A New Economic Indicator for Wyoming: Average Weekly Hours of All Employees on Private Nonfarm Payrolls
At a time when the economy is a focus of much attention and speculation, wouldn’t it be helpful to have a new economic indicator at the state level? Starting this month, Research & Planning will include a new table in Wyoming Labor Force Trends featuring average weekly hours of all employees on private nonfarm payrolls.
These data are produced as part of the Current Employment Statistics (CES) program, which also produces monthly estimates of employment by industry sector (see Wyoming Nonagricultural Wage and Salary Employment).
For many years the Economic Indicators Table has included average weekly hours and earnings for manufacturing production workers in the 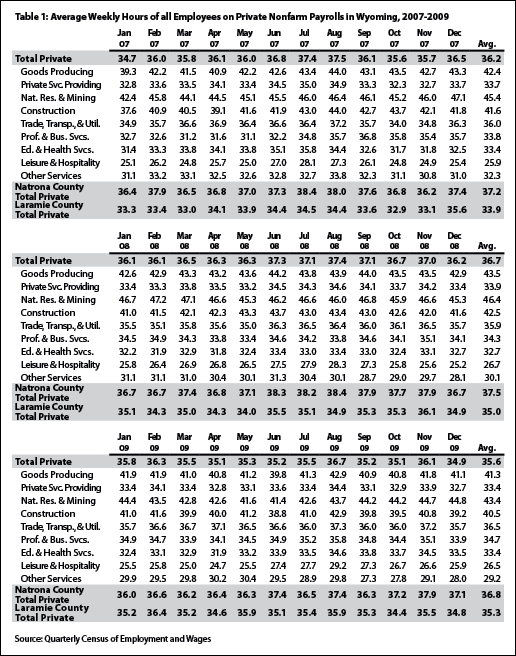 state. Valuable as these data may be, they represent a relatively small group of workers (approximately 6,400 employees in Wyoming). In contrast, the newly available average weekly hours series (see Table 1) represent thehours of all private nonfarm wage and salary workers (approximately 200,000 employees). Therefore, these hours series account for a much larger and broader portion of the state’s economy. Further, Table 1 provides industry detail allowing data users to compare trends across sectors. Comparing annual averages shows, for example, that average hours in natural resources & mining increased from 45.4 in 2007 to 46.4 in 2008 and then decreased to 43.4 in 2009. Average hours at the total private level followed a similar pattern by increasing in 2008 and then decreasing in 2009.
Comparison with Other Average Weekly Hours Series
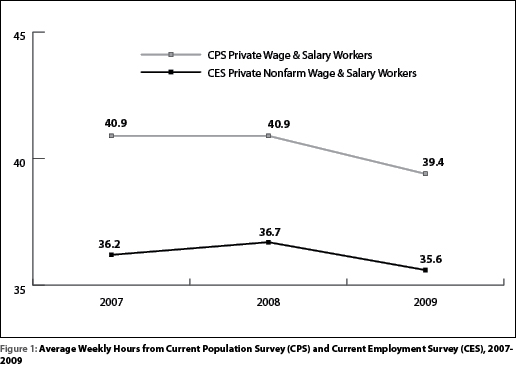 In an effort to validate the average weekly hours series from the CES program, they were compared with unpublished hours data from the Current Population Survey (CPS), a monthly survey of households. Figure 1 shows the annual averages of the two series from 2007 to 2009.
There are several key differences between the two data series that help explain why the CPS series is higher than the CES series. First, the CPS data are a total of weekly hours worked at all jobs (i.e. multiple jobholders add up the hours spent at each job) and are therefore higher than the CES data which represent the average number of hours per job (including both full and part-time workers). Also, CPS data are reported by residents of the state (regardless of place of work), while the CES data are for individuals working in Wyoming (regardless of place of residence). Recent tables published by Research & Planning suggest that nonresidents are much more likely to be found working in certain industries (construction and leisure & hospitality, for example) than others (Glover, 2009).
While CPS average weekly hours did not change from 2007 to 2008, they decreased by 1.5 hours from 2008 to 2009. The CES hours increased from 2007 to 2008, and then decreased by 1.1 hours from 2008 to 2009. Given the limited data available on average weekly hours in Wyoming, the CES hours seem reasonable because they follow the same general trend as the CPS hours series.
Lead Indicator of Employment
Economists have long recognized that average hours are an importanteconomic indicator. “Average weekly hours are a sensitive 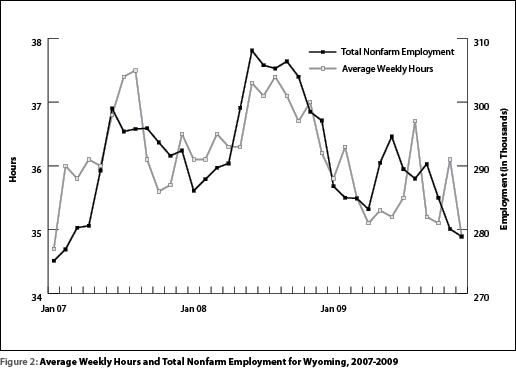 barometer of labordemand. Employers generally prefer to increase or decrease hours worked before hiring or laying off workers” (Frumkin, 1990 p. 13). In other words, average hours tend to be a leading indicator of employment trends. Figure 2 shows the average weekly hours from 2007 to 2009 compared to total nonfarm employment over the same period. While there is some month-to-month variability in the hours series, it appears that hours followed a similar pattern to employment, by increasing in 2008 and decreasing in 2009.
Table 2 shows that average hours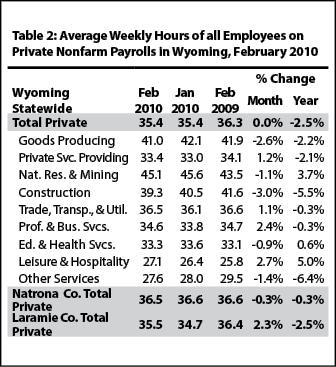 increased from February 2009 to February 2010 in the natural resources & mining sector. This may signal that firms in this sector have increased their demand for labor, and increased hiring may follow. In contrast, hours in the construction sector decreased by 5.5% from February 2009 to February 2010, possibly indicating lower future employment levels in this sector.
Data Quality Issues
There are approximately 2,700 employing locations in the CES survey in Wyoming and the January response rate was 70.9%. Collectively, organizations responding to the survey in January 2010 accounted for 118,234 employees, or approximately 43.4% of total nonfarm employment. However, not all employers that respond to the survey report their workers’ hours and earnings. In fact, fewer than three-fifths (59.6%) of firms that reported employment levels in February 2010 also reported hours and earnings. Statisticians call this phenomena item nonresponse and to ensure data quality, the federal government has a standard of at least 70% for item response (OMB, 2006). Since all private sector firms in the sample are asked to report hours and earnings, and the 40% who do not are not randomly distributed there is the significant possibility of a bias in the estimates of average weekly hours.
In summary, while the new average weekly hours series have great potential as economic indicators for the state, and appear reasonable compared to other economic series, questions remain about data quality issues, including the possibility of bias because of a high level of item nonresponse.
Contact Senior Economist David Bullard at dbulla@state.wy.us.
References
Frumkin, N. (1990). Guide to economic indicators. Armonk, NY: M.E. Sharpe.
Glover, W. (2009, December). Earnings by age, gender & industry 1992 to 2008. Retrieved March 22, 2010, from http://doe.state.wy.us/LMI/earnings_tables/county.htm
Office of Management and Budget. (2006, September). Standards and guidelines for statistical surveys. Retrieved March 22, 2010, from http://www.whitehouse.gov/omb/assets/omb/inforeg/statpolicy/standards_stat_surveys.pdf