Covered Employment and Wages for Third Quarter 2009: Mining Payroll Declines by $120.9 Million
On an over-the-year basis, employment fell by 15,980 jobs (-5.4%) and the average weekly wage decreased by $26 (-3.3%) from third quarter 2008 to third quarter 2009. Employment decreased in 20 counties and increased in 3.
 construction (-$74.6 million, or -20.5%). UI covered payroll representsapproximately 92% of all wage and salary disbursements and 45% of personal income in the state (U.S. Bureau of Economic Analysis, 2007).
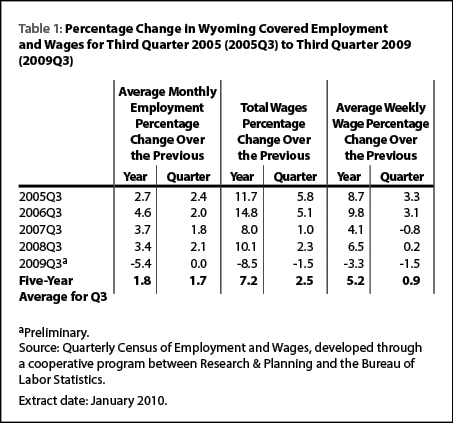
Table 1 shows the sharp contrast between the large job losses in third quarter 2009 and the rapid growth seen in earlier years. Total payroll is an important economic indicator because it is often associated with consumer spending, retail sales, and sales tax revenue (Black & Evans, 1997).
The covered payroll and employment data in this article are measured by place of work in contrast to the labor force estimates (see page 25) which are a measure of employed and unemployed persons by place of residence. Also, the employment data presented in this article represent a count of jobs, not persons. When individuals work more than one job, each is counted separately.
The Figure shows that growth in total wages, which peaked at 17.1% in 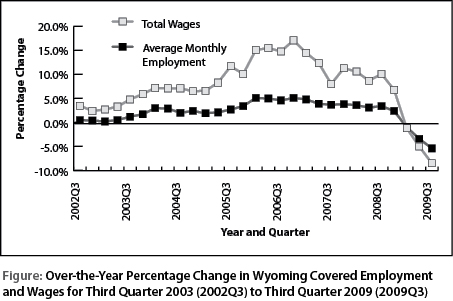 fourth quarter 2006, turned negative in first quarter 2009 and decreased to -8.5% in third quarter. Employment growth continued to decline, reaching -5.4% (see Table 2).
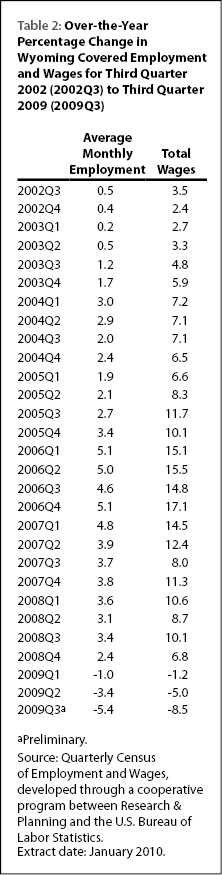
The purpose of this article is to show employment and payroll changes between third quarter 2008 and third quarter 2009. These economic changes help gauge the overall strength of Wyoming’s economy and identify the fastest and slowest growing sectors and geographic areas.
Employment and Wages by County
Table 3 shows that employment  increased in 3 counties and decreased in 20. All 3 counties where employment increased were located in the southeast region of the state.
Albany County added 221 jobs (1.4%) and its total payroll grew by $5.3 million (3.9%). State government employment increased by approximately 500 jobs and smaller gains were seen in federal government, agriculture, construction, and health care & social assistance. These job gains were partially offset by job losses in manufacturing (approximately 100 jobs), professional & technical services (approximately 100 jobs), and accommodation & food services (approximately 100 jobs).
Platte County gained 81 jobs (2.5%) and its total payroll increased by $1.1 million (4.4%). Modest job gains were seen in agriculture, local government, manufacturing, and other sectors.
Employment in Niobrara County grew by 33 jobs (3.9%) and its total payroll increased by $0.7 million (12.8%). Job gains occurred in retail trade, health care & social assistance, and other services. Employment decreased slightly in accommodation & food services and construction.
In Sweetwater County employment fell by 2,520 jobs (-9.7%) and total payroll decreased by $53.1 million (-16.3%). The largest job losses occurred in mining (including oil & gas; nearly 1,000 jobs) and construction (more than 800 jobs). Smaller job losses were reported in many sectors, including wholesale trade, retail trade, transportation & warehousing, professional & technical services, and administrative & waste services.
Teton County lost 1,825 jobs (-8.4%) and its total payroll fell by $28.9 million (-14.1%). Construction posted the largest job losses (more than 600 jobs) followed by accommodation & food services (approximately 400 jobs) and retail trade (approximately 200 jobs). Employment increased slightly in local government (including public schools).
Uinta County’s total payroll decreased by $12.5 million (-12.2%) and employment fell by 1,035 jobs (-9.7%). As in many other counties, the largest job losses occurred in construction (more than 500 jobs). Employment also decreased in mining (including oil & gas; more than 150 jobs), wholesale trade, retail trade, and accommodation & food services.
In Sheridan County, employment decreased by 763 jobs (-5.4%) and total payroll fell by $12.4 million (-9.5%). Job losses were seen in mining (including oil & gas; more than 250 jobs), construction (more than 250 jobs), retail trade (more than 100 jobs), and health care & social assistance (approximately 100 jobs).
Carbon County saw its total payroll decrease by $13.6 million (-18.0%) and employment fall by 755 jobs (-9.7%). As in several other counties, the largest job losses were in construction (approximately 400 jobs) and mining (including oil & gas; nearly 200 jobs).
Campbell County lost 724 jobs (-2.5%) and its total payroll fell by $11.6 million (-3.1%). Mining employment (including oil & gas) decreased by more than 500 jobs and smaller job losses were seen in administrative & waste services (more than 100 jobs), transportation & warehousing (approximately 100 jobs), retail trade (approximately 100 jobs), and construction (fewer than 100 jobs). Job gains occurred in local government (including public schools), wholesale trade, and health care & social assistance.
Table 4 shows that Natrona County lost 2,835 jobs (-7.0%) and its total payroll 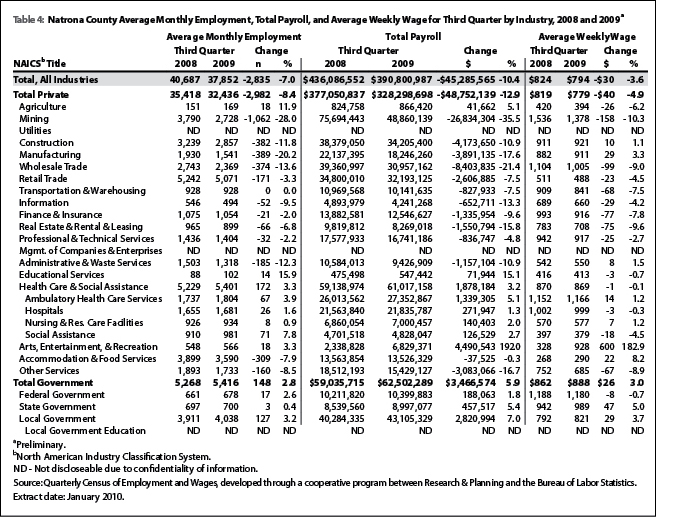 fell by $45.3 million (-10.4%). Mining (including oil & gas) had the largest job losses (-1,062 jobs, or -28.0%) and the largest decrease in total payroll (-$26.8 million, or -35.5%). Sizeable job losses also occurred in construction (-382 jobs, or -11.8%), manufacturing (-389 jobs, or -20.2%), wholesale trade (-374 jobs, or -13.6%), and accommodation & food services (-309 jobs, or -7.9%). Health care & social assistance posted the largest job gains (172 jobs, or 3.3%) followed by local government (127 jobs, or 3.2%).
In Laramie County total payroll increased slightly ($2.4 million, or 0.6%) and job losses were much smaller than in Natrona County (-951 jobs, or 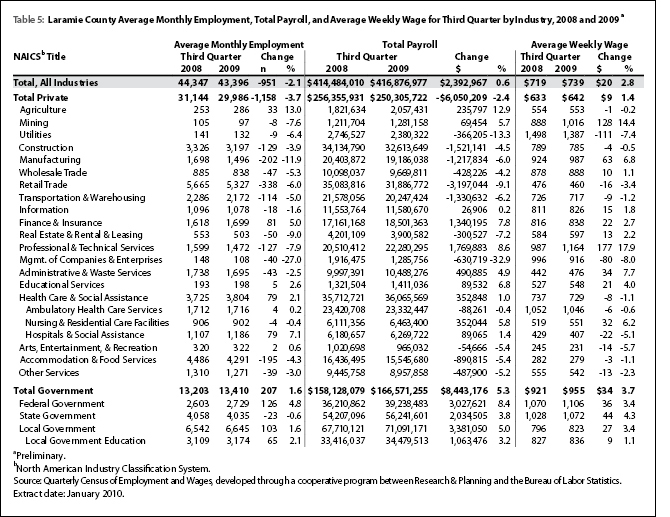 -2.1%; see Table 5). The largest job losses occurred in retail trade (-338jobs, or -6.0%), manufacturing (-202 jobs, or -11.9%), and accommodation & food services (-195 jobs, or -4.3%). Employment increased in federal government (126 jobs, or 4.8%), local government (including public schools & colleges; 103 jobs, or 1.6%), finance & insurance (81 jobs, or 5.0%), and health care & social assistance (79 jobs, or 2.1%).
Statewide Employment and Wages by Industry
Table 6 shows that job gains occurred in local government, health care & 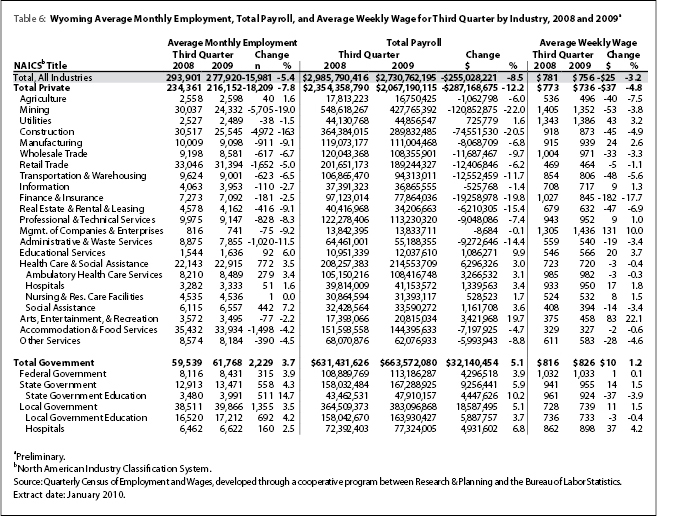 social assistance, state government, and federal government. Large job losses were reported in mining, construction, retail trade, accommodation & food services, and administrative & waste services.
Local government added 1,355 jobs (3.5%) and its total payroll increased by $18.6 million (5.1%). Employment in public hospitals increased by 160 jobs (2.5%) and educational services (including public schools and colleges) added 692 jobs (4.2%). Public administration (including cities, towns, and counties) gained more than 250 jobs.
Employment in health care & social assistance increased by 772 jobs (3.5%). Social assistance gained 442 jobs (7.2%) and its total payroll grew by $1.2 million (3.6%). Ambulatory health care services, which includes doctor’s offices, added 279 jobs (3.4%) and private hospitals added 51 jobs (1.6%).
Total payroll in state government grew by $9.3 million (5.9%) and employment increased by 558 jobs (4.3%). Most of the increase in employment occurred in state government education (511 jobs, or 14.7%).
Federal government added 315 jobs (3.9%) and its total payroll increased by $4.3 million (3.9%). Hospitals gained more than 100 jobs and administration of environmental programs gained approximately 100 jobs.
Wyoming’s mining sector saw its total payroll decrease by $120.9 million (-22.0%) and employment fall by 5,705 jobs (-19.0%). The largest job losses occurred in support activities for mining (approximately 4,800 jobs). Oil & gas extraction lost approximately 700 jobs and mining, except oil & gas lost nearly 200 jobs.
Construction employment fell by 4,972 jobs (-16.3%) and its total payroll decreased by $74.6 million (-20.5%). Job losses were seen in all areas of construction. Construction of buildings lost approximately 550 jobs, heavy & civil engineering construction lost nearly 2,400 jobs, and specialty trade contractors lost more than 2,000 jobs.
Employment also decreased in retail trade, where 1,652 jobs (-5.0%) were lost and total payroll fell by $12.4 million (-6.2%). Sizeable job losses were seen in motor vehicle & parts dealers (approximately 350 jobs), gasoline stations (more than 300 jobs), nonstore retailers (nearly 300 jobs), and building material & garden supply stores (approximately 200 jobs).
Employment in accommodation & food services decreased by 1,498 jobs (-4.2%). Total payroll fell by $7.2 million (-4.7%). Food services & drinking places lost nearly 700 jobs and accommodation lost approximately 800 jobs.
Administrative & waste services lost 1,020 jobs (-11.5%) and its total payroll fell by $9.3 million (-14.4%). By far the largest job losses were in employment services (including temporary help agencies; more than 700 jobs). Employment also decreased in services to buildings & dwellings (approximately 150 jobs) and business support services (approximately 100 jobs).
In summary, large job losses were seen in most sectors of Wyoming’s economy and in all but three counties during third quarter. Mining and construction, two sectors that grew rapidly in 2006 and 2007 saw large employment declines. Together, their total payroll decreased by nearly $200 million.
Contact Senior Economist David Bullard at dbulla@state.wy.us.
References
Black, D. & Evans, M. (1997, May). Work, pay and consumer spending, part one: Sales tax collections and total payroll. Wyoming Labor Force Trends, 34(5), Retrieved September 11, 2008, from http://doe.state.wy.us/LMI/0597/0597a2.htm
U.S. Bureau of Economic Analysis. (2007, May 15). SA04 State income and employment summary — Wyoming. Retrieved May 15, 2007, from http://www.bea.gov/regional/spi/default.cfm