Covered Employment and Wages for Second Quarter 2009: Job Losses Accelerate
On an over-the-year basis, employment fell by 10,132 jobs (-3.5%) and average weekly wage decreased by $12 (-1.5%) from second quarter 2008 to second quarter 2009. Job losses were reported in more than four-fifths of Wyoming counties and in 13 industry sectors.
From second quarter 2008 to second quarter 2009, total unemployment insurance (UI) covered payroll decreased by $145.4 million (-5.0%). UI covered payroll represents approximately 92% of all wage and salary disbursements and 45% of personal income in the state (U.S. Bureau of Economic Analysis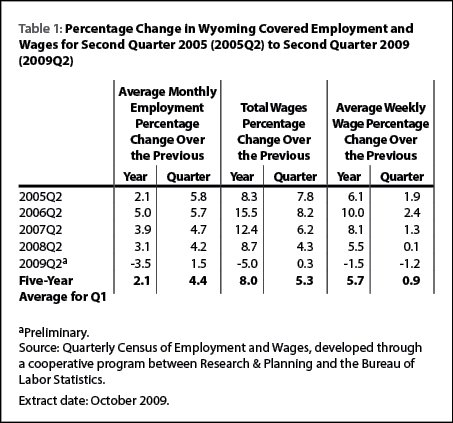 , 2007). Table 1 shows the contrast between current decreases in jobs andpayroll and the strong growth seen in earlier years. Total payroll is an important economic indicator because it is often associated with consumer spending, retail sales, and sales tax revenue (Black & Evans, 1997).
The covered payroll and employment data in this article are measured by place of work, in contrast to the labor force estimates that are a measure of employed and unemployed persons by place of residence. Also, the employment data presented in this article represent a count of jobs, not persons. When individuals work more than one job, each is counted separately.
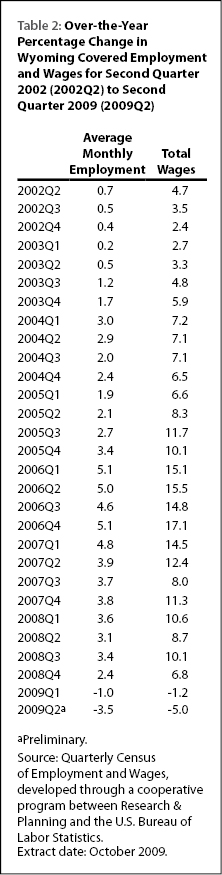
The Figure shows that employment and wages both fell at faster rates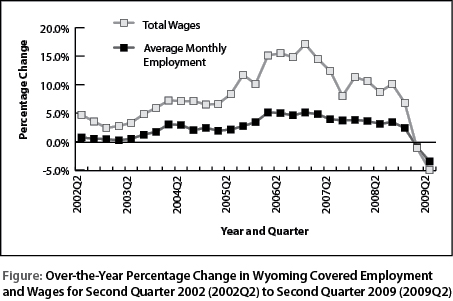 than inse in payroll growth was especiallyapparent. Payroll growth stood at 10.1% in third quarter 2008, but dec the first quarter. The rapid decreareased to -1.2% in first quarter 2009 and -5.0% in second quarter 2009 (see Table 2). Job
  growth also decreased steadily from 3.4% in third quarter 2008 to -3.5% in second quarter 2009.
The purpose of this article is to show employment and payroll changes between second quarter 2008 and second quarter 2009. These economic changes help gauge the overall strength of Wyoming’s economy and identify the fastest and slowest growing sectors and geographic areas.
Employment and Wages by County
Table 3 shows that employment 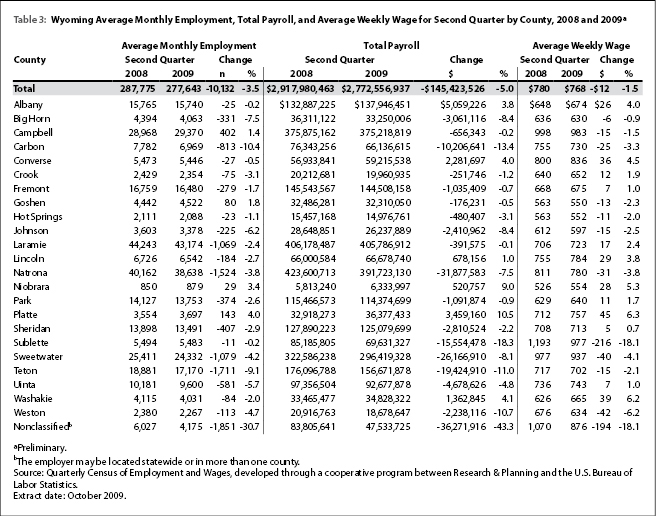 increased in 4 counties and decreased in 19. Three of the 4 counties with employment gains were located in the southeast region of the state.
Campbell County added 402 jobs (1.4%), but its total payroll decreased by $0.7 million (-0.2%). Job gains were seen in construction (approximately 200 jobs), local government (more than 150 jobs), accommodation & food services (more than 100 jobs), and wholesale trade (approximately 100 jobs). Employment decreased in mining (including oil & gas; more than 150 jobs), manufacturing, retail trade, professional & technical services, and administrative & waste services.
Platte County’s employment grew by 143 jobs (4.0%) and its total payroll increased by $3.5 million (10.5%). Employment increased in agriculture (approximately 50 jobs), construction (approximately 50 jobs), local government, and federal government.
Goshen County added 80 jobs (1.8%), but its total payroll decreased by $176,231 (-0.5%). Job gains were seen in local government (including public schools; more than 50 jobs), construction (more than 50 jobs), federal government, and state government.
Niobrara County added 29 jobs (3.4%) and its total payroll increased by $520,757 (9.0%). Job gains were seen in local government, retail trade, health care & social assistance, and other services.
Teton County lost 1,711 jobs (-9.1%) and its total payroll fell by $19.4 million (-11.0%). Employment decreased in accommodation & food services (nearly 800 jobs), construction (nearly 400 jobs), retail trade (approximately 150 jobs), arts, entertainment & recreation (more than 100 jobs), and professional & technical services (approximately 100 jobs). Marginal job gains were seen in local government and federal government.
Employment fell by 1,079 jobs (-4.2%) in Sweetwater County and total payroll decreased by $26.2 million (-8.1%). Construction posted the largest job losses (nearly 500 jobs), followed by mining (including oil & gas; more than 400 jobs) and administrative & waste services (approximately 150 jobs). Local government (including public schools and colleges) added more than 200 jobs and health care & social assistance added approximately 100 jobs.
Carbon County’s total payroll decreased by $10.2 million (-13.4%) in second quarter and employment fell by 813 jobs (-10.4%). Large job losses were seen in construction (nearly 500 jobs), mining (including oil & gas; more than 150 jobs), and accommodation & food services (more than 100 jobs). Smaller job losses occurred in retail trade, transportation & warehousing, professional & technical services, and health care & social assistance.
Uinta County lost 581 jobs (-5.7%) and its total payroll fell by $4.7 million (-4.8%). Construction employment decreased by nearly 350 jobs, and mining employment decreased by approximately 150 jobs. Job losses were also seen in several other sectors.
Sheridan County’s employment fell by 407 jobs (-2.9%) and its total payroll decreased by $2.8 million (-2.2%). Job losses in construction (more than 300 jobs), mining (including oil & gas; more than 150 jobs), and manufacturing (approximately 50 jobs) were partially offset by job gains in local government (more than 100 jobs), accommodation & food services (approximately 100 jobs), and federal government (more than 50 jobs).
Park County’s employment fell by 374 jobs (-2.6%) and its total payroll decreased by $1.1 million (-0.9%). Job losses in mining, construction, retail trade, and accommodation & food services were partially offset by gains in local government and private educational services.
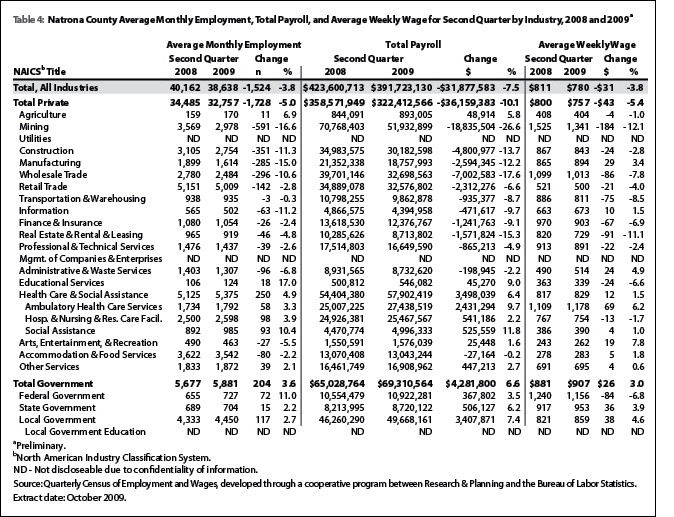
Table 4 shows that Natrona County lost 1,524 jobs (-3.8%).  Total payroll decreased by $31.9 million (-7.5%). Large job losses were seen in mining (including oil & gas; -591 jobs, or -16.6%), construction (-351 jobs, or -11.3%), wholesale trade (-296 jobs, or -10.6%), manufacturing (-285 jobs, or -15.0%), and retail trade (-142 jobs, or -2.8%). Employment grew in health care & social assistance (250 jobs, or 4.9%), local government (including public schools and colleges; 117 jobs, or 2.7%), and federal government (72 jobs, or 11.0%).
Employment in Laramie County fell by 1,069 jobs (-2.4%; see Table 5). Total payroll decreased marginally (-$0.4 million, or -0.1%) as payroll 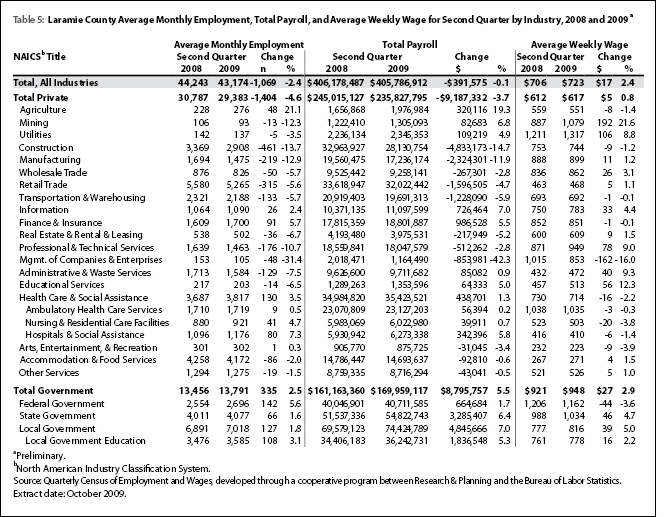 decreases in the private sector were mostly offset by payroll gains in government. Job growth was seen in federal government (142 jobs, or 5.6%), health care & social assistance (130 jobs, or 3.5%), and local government (127 jobs, or 1.8%). Employment decreased substantially in construction (-461 jobs, or -13.7%), retail trade (-315 jobs, or -5.6%), manufacturing (-219 jobs, or -12.9%), and professional & technical services (-176 jobs, or -10.7%).
Statewide Employment and Wages by Industry
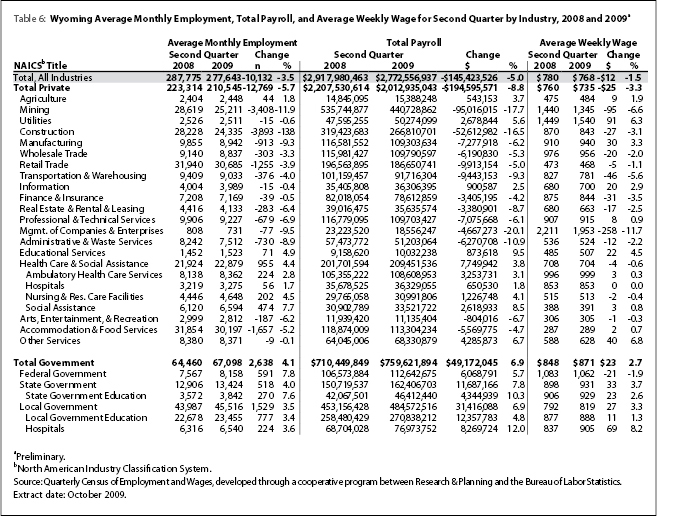
Table 6 shows that the largest job gains occurred in local government,  health care & social assistance, federal government, and state government. Substantial job losses were seen in construction, mining, accommodation & food services, retail trade, and manufacturing.
Local government added 1,529 jobs (3.5%). Its total payroll increased by $31.4 million (6.9%). Local government education (including public schools and colleges) gained 777 jobs (3.4%) and hospitals gained 224 jobs (3.6%). Public administration (including cities, towns, and counties) grew by nearly 250 jobs. Arts, entertainment, & recreation (including gambling) added approximately 150 jobs.
Total payroll in health care & social assistance increased by $7.7 million (3.8%) and employment grew by 955 jobs (4.4%). The largest job growth was seen in social assistance, which added 474 jobs (7.7%).
Federal government gained 591 jobs (7.8%) and its total payroll grew by $6.1 million (5.7%). Administration of economic programs added more than 300 jobs, hospitals added more than 100 jobs, and administration of environmental programs added approximately 100 jobs.
Total payroll in state government increased by $11.7 million (7.8%) and employment grew by 518 jobs (4.0%). Educational services added 270 jobs; justice, public order, & safety activities added approximately 100 jobs; and smaller gains were reported in a number of other areas.
Construction employment decreased by 3,893 jobs (-13.8%) and its total payroll fell by $52.6 million (-16.5%). Heavy & civil engineering construction lost approximately 1,800 jobs, specialty trade contractors lost more than 1,650 jobs, and construction of buildings lost approximately 400 jobs.
The largest decrease in total payroll was found in the mining sector (-$95.0 million, or -17.7%). Employment fell by 3,408 jobs (-11.9%). Oil & gas extraction lost approximately 500 jobs, and support activities for mining lost approximately 2,900 jobs, but employment in mining, except oil & gas was fairly stable.
Total payroll in accommodation & food services decreased by $5.6 million (-4.7%) and employment fell by 1,657 jobs (-5.2%). Accommodation lost approximately 1,150 jobs, and food services & drinking places lost approximately 500 jobs. Full service restaurants cut approximately 350 jobs, limited service eating places cut approximately 150 jobs, but employment in drinking places increased slightly.
Retail trade lost 1,255 jobs (-3.9%) and its total payroll decreased by $9.9 million (-5.0%). The largest job losses occurred in motor vehicle & parts dealers (approximately 450 jobs), nonstore retailers (approximately 250 jobs), and miscellaneous store retailers (approximately 150 jobs). Job losses were also seen in furniture & home furnishings stores (approximately 100 jobs), building material & garden supply stores (approximately 100 jobs), gasoline stations (approximately 100 jobs), clothing & clothing accessories stores (more than 100 jobs), and sporting goods, hobby, book, & music stores (more than 50 jobs). Employment increased in general merchandise stores by more than 100 jobs.
Manufacturing employment fell by 913 jobs (-9.3%) and its total payroll fell by $7.3 million (-6.2%). Fairly large job losses were seen in fabricated metal product manufacturing (more than 200 jobs), wood product manufacturing (more than 150 jobs), transportation equipment manufacturing (more than 150 jobs), and plastics & rubber product manufacturing (approximately 150 jobs). Smaller job losses were reported in printing & related support activities, petroleum & coal products manufacturing, chemical manufacturing, and nonmetallic mineral product manufacturing.
In summary, job losses accelerated in second quarter and affected most areas of the state. The largest job losses were in construction, mining, and accommodation & food services. Modest job gains were largely confined to government sectors.
References
Black, D. & Evans, M. (1997, May). Work, pay and consumer spending, part one: Sales tax collections and total payroll. Wyoming Labor Force Trends, 34(5). Retrieved September 11, 2008, from http://doe.state.wy.us/LMI/0597/0597a2.htm
U.S. Bureau of Economic Analysis. (2007, May 15). SA04 State income and employment summary -- Wyoming. Retrieved May 15, 2007, from http://www.bea.gov/regional/spi/default.cfm
U.S. Census Bureau. (2007, August 28). 2007 NAICS codes and titles. Retrieved September 20, 2007, from http://www.census.gov/naics/2007/NAICOD07.HTM