Local Jobs and Payroll in Wyoming: Job Growth Remains Weak in First Quarter 2013
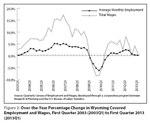 |
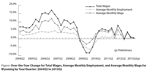
Total unemployment insurance (UI) covered payroll increased by $31.4 million (1.1%) in first quarter 2013. Employment rose by 460 jobs (0.2%) and average weekly wage increased by $7 (0.8%). In first quarter, employment grew slightly faster than its five year average, but total wages and average weekly wage both grew at a slower pace than their five year averages (see Table 1). Job losses in the mining sector (including oil & gas) became deeper (-1,700 jobs, or -6.0%) and overall job growth weakened further. Additionally, employment at temporary help agencies fell by approximately 250 jobs.
Related Tables and Figures
Continue Reading →
Also inside October Trends:
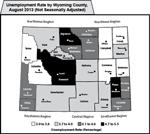
Wyoming Unemployment Rate Stable at 4.6% in August 2013
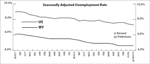 |
The Research & Planning section of the Wyoming Department of Workforce Services reported that the state’s seasonally adjusted unemployment rate was 4.6% in August. It has remained at that level since May. Wyoming’s unemployment rate decreased from its year-ago level of 5.4% and was significantly lower than the current U.S. unemployment rate of 7.3%. Seasonally adjusted employment of Wyoming residents fell slightly, decreasing by 444 individuals (-0.2%) from July to August.
Continue Reading →
Table of Contents
- PDF Version
- Credits
- Local Jobs and Payroll in Wyoming: Job Growth Remains Weak in First Quarter 2013
- Total Wages, Average Monthly Employment, and Average Monthly Wage Changes for Wyoming by Year/Quarter: 2004Q2 to 2013Q2
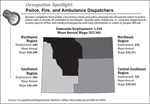
- Occupation Spotlight: Police, Fire, and Ambulance Dispatchers
- Persons Working in Jobs Covered by Wyoming State Unemployment Insurance, Second Quarter 2013
- Quarterly Turnover Statistics by Industry, First Quarter 2013
- Wyoming Unemployment Rate Stable at 4.6% in August 2013
- Current Employment Statistics (CES) Estimates and Research & Planning’s Short-Term Projections, August 2013
- Wyoming Nonagricultural Wage and Salary Employment
- Campbell County
- Sweetwater County
- Teton County
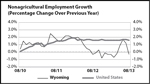
- Nonagricultural Employment Growth Graph
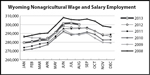
- Nonagricultural Wage and Salary Employment Graph
- Economic Indicators
- Wyoming Total Nonfarm Employment
- Selected U.S. Employment Data
- Multiple Jobholders
- Discouraged Workers
- Part-Time for Economic Reasons
- Consumer Price Index
- Wyoming Building Permits
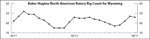
- Baker Hughes Rig Count
- Wyoming County Unemployment Rates
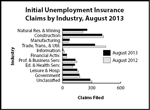
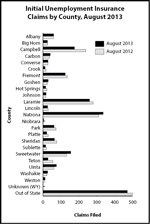
- Wyoming Normalized Unemployment Insurance Statistics: Initial Claims
- Statewide
- Laramie County
- Natrona County
- Statewide by Industry Graph
- Statewide by County Graph
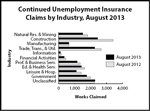
- Wyoming Normalized Unemployment Insurance Statistics: Continued Claims
- Statewide
- Laramie County
- Natrona County
- Statewide by Industry Graph
- Statewide by County Graph
- Map of Wyoming Regions, Counties, and County Seats with County Unemployment Rates