
Examining the Demographics of New Hires
See related tables and figures
The Research & Planning (R&P) section of the Wyoming Department of Workforce Services uses several surveys and administrative databases to gather and analyze detailed information about Wyoming's labor market. It wasn't until the implementation of R&P's New Hires Survey in 2010, however, that it became possible to identify the demographic structure of each occupation for which new workers are hired (Knapp, 2011).
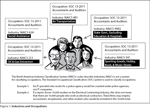
This article examines the demographics among new hires in Wyoming by using data collected through the New Hires Survey. It will describe the types of jobs that males, females, and nonresidents were hired to fill, in addition to revealing in which industries they worked, and will also look at the occupations for which younger (under 25) and older (55 and older) workers were hired. An explanation of industries and occupations can be found in Figure 1.
 |
This article focuses only on newly hired workers from fourth quarter 2010 (2010Q4) to third quarter 2011 (2011Q3). A new hire is defined as an employee who has not worked for the hiring employer at any time since 1992, the first year for which comparable data are available. This article does not include re-hires or those who have been continuously employed by the same firm.
Also, the New Hires Survey is not able to capture information on workers who upgrade their skills while working for the same employer. For example, a person may pursue a nursing degree while working for a health care-related employer. Upon completion of that degree, the person may accept a position as a registered nurse with that same employer. Because the person worked for the same employer throughout this duration, he or she would not be considered a new hire and would not appear in this survey.
The first article in this series was published in the June 2012 issue of Wyoming Labor Force Trends (Knapp, 2012). More information on the New Hires Survey, including articles, detailed tables, and methodology, is available online at http://doe.state.wy.us/LMI/newhires.htm.
Gender
Where Do They Work?
New Hires by Industry
 |
From 2010Q4 to 2011Q3, Wyoming employers added 129,361 new hires. Of these new hires, 44.2% were males, 38.7% were females, and demographic information was unavailable for the remaining 17.1%, who are defined as nonresidents (see Figure 2).
Wyoming historically has provided jobs to a large number of nonresident workers; these are workers who do not have a Wyoming-issued driver's license and work less than four quarters in Wyoming (Jones, 2002). Nonresident workers often are found in industries that rely on seasonal help, and some also travel to Wyoming to work in the mining industry during times of economic expansion. The number of nonresident workers in-migrating to Wyoming for work has increased dramatically since 2006. In 1992, nonresidents made up 9.8% of Wyoming's workforce. In 2011, that percentage nearly doubled to 17.7%. The nonresident dynamic of Wyoming's workforce will be explored in an article in the September 2012 issue of Wyoming Labor Force Trends.
|
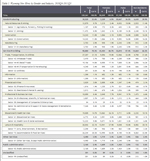
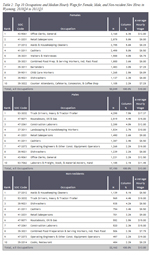
From 2010Q4 to 2011Q3, Wyoming employers hired 22,162 nonresident workers (see Table 1). Of these, 25.1% were hired in leisure & hospitality; 21.6% were hired in trade, transportation, & utilities; 16.2% were hired in construction; and 11.4% were hired in natural resources & mining.
The two industries in which the most new hires were added during this period were leisure & hospitality (22.1%) and trade, transportation, & utilities (21.1%). These industries have a seasonal component that provides short-term jobs, so it is logical that these industries would make up a large portion of all new hires.
More than one-third (36.2%) of male new hires worked in goods-producing industries, compared to just 6.5% of all female new hires. Of the 57,150 male new hires, 16.8% worked in construction and 15.5% worked in natural resources & mining, both of which are goods-producing industries.
What Do They Do?
New Hires by Occupation
|
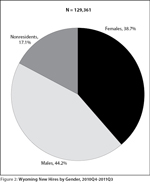
From 2010Q4 to 2011Q3, most female new hires in Wyoming were hired to work in relatively low-paying occupations that do not require any education beyond high school, such as retail salespersons, maids & housekeeping cleaners, and cashiers (see Table 2). Males were often hired to fill jobs that offer higher wages and demand more physical labor, such as truck drivers, heavy & tractor trailer; roustabouts, oil & gas; and operating engineers & other construction equipment operators. Of the top 10 occupations for female new hires, only one (office clerks, general) paid more than $10 an hour, compared to seven of the top 10 for male new hires. A future article will explore wage disparity among new hires in Wyoming.
Nonresidents made up 17.1% of all new hires in Wyoming. Most were hired for occupations that did not require any education beyond a high school diploma, such as truck drivers, heavy & tractor-trailer; maids & housekeeping cleaners; dishwashers; and cashiers.
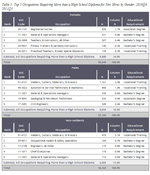 |
Only 10.0% of all female new hires worked in jobs that required any education beyond a high school diploma, such as registered nurses (836, or 1.7%) and general & operations managers (231, or 0.5%). A similar percentage of males (10.2%) were hired for occupations that required more than a high school diploma. Some of these, such as welders, cutters, solderers, & brazers (1,161, or 2.0%), required vocational training while others, such as civil engineers (205, or 0.4%) required a bachelor's degree. Of all nonresident new hires, 11.6% were hired for jobs that required more than a high school diploma (see Table 3). Many of these were high paying jobs that required a bachelor's degree, such as occupational health & safety specialists; engineers, all other; and chief executives.
Age Groups
Where do they work?
New hires by industry
 |
 |
 |
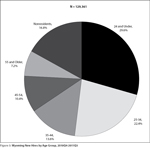
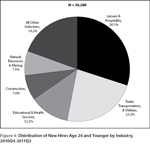
From 2010Q4 to 2011Q3, 29.6% of all new hires were under the age of 25 (see Figure 3). More than half of these younger workers were hired to work in two industries: leisure & hospitality (30.1%) and trade, transportation, & utilities (23.2%; see Figure 4). These are both industries that offer lower-paying jobs with seasonal hiring patterns.
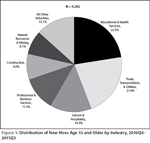
Wyoming employers also made a significant investment in older workers, as 7.2% (9,282) of all new hires were age 55 or older. These older workers were most frequently hired to work in educational & health services (22.5%) and trade, transportation, & utilities (21.6%; see Figure 5).
What do they do?
New hires by occupation
|
|
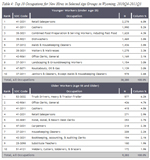
Younger workers ages 16 to 24 were most often hired to fill low-paying jobs that required no formal education beyond a high school diploma (see Table 4). Examples of this include retail salespersons (2,278, or 6.0%), cashiers (1,990, or 5.2%), and combined food preparation & serving workers, including fast food (1,628, or 4.3%).
Older workers ages 55 and older were hired to fill many of these same types of occupations, such as office clerks, general (436, or 4.7%), cashiers (415, or 4.5%), and retail salespersons (271, or 2.9%; see Table 4). The occupation for which the greatest number of older new hires was added was truck drivers, heavy & tractor-trailer (577, or 6.2%).
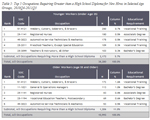
Only 5.7% (2,172) of all new hires under the age of 25 were hired to fill occupations that require more than a high school degree, compared to 16.2% (1,206) of all new hires ages 55 and older (see Table 5). Many of these older and younger workers were both hired to fill the same occupations that required some education beyond high school. Three such occupations – welders, cutters, solderers, & brazers; registered nurses; and automotive service technicians & mechanics – appeared in the top 5 occupations requiring more than a high school diploma for both age groups.
Future Studies
The rich data collected through the New Hires Survey make it possible to identify the types of occupations for which males and females are being hired and what they are being paid. Future articles will examine wage disparity among male and female new hires, turnover among new hires, and how new hires from 2011 compared to new hires from 2010.
References
Jones, S. (2002). Defining residency for the Wyoming workforce. Wyoming Labor Force Trends, 39(11). Retrieved August 1, 2012, from http://doe.state.wy.us/LMI/1102/a1.htm
Knapp, L. (2011). New hires in Wyoming: an in-depth analysis. Wyoming Labor Force Trends, 48(2). Retrieved June 18, 2012, from http://doe.state.wy.us/LMI/0211/a1.htm
Knapp, L. (2012). Wyoming new hires in 2011, part 1: Even during an economic downturn, Wyoming employers continued to hire new workers. Wyoming Labor Force Trends, 49(6). Retrieved August 13, 2012, from http://doe.state.wy.us/LMI/trends/0612/a1.htm