
Wyoming New Hires in 2011, PART 1
Even During an Economic Downturn, Wyoming Employers Continued to Hire New Workers
See related Tables and Figures
Wyoming employers are constantly hiring new workers. Whether total employment is increasing, declining, or stagnant, hiring activity is always occurring. This article is the first in a series that examines the characteristics of jobs for which new workers were hired from fourth quarter 2010 (2010Q4) to third quarter 2011 (2011Q3).
Since fourth quarter 2009 (2009Q4), the Research & Planning (R&P) section of the Wyoming Department of Workforce Services has conducted a New Hires Job Skills Survey designed to collect information about the jobs hired in Wyoming. The data collected by this survey provide a rich source of information about occupations in the state that would otherwise be unavailable. This includes data on demographics, benefits, skills, wage rates, and the gender wage gap. This data is available at both the state and the sub-state regional levels.
 |
 |
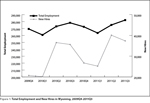
During the state's economic downturn in 2009, when total employment decreased substantially, Wyoming employers continued to hire new workers (see Figure 1). From 2009Q4 to 2010Q3, Wyoming employers added 112,065 new hires.
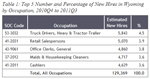
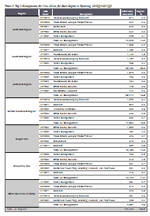
From 2010Q4 to 2011Q3, as the state was recovering from that downturn, employers added 129,369 new hires, an increase of 17,304. During this time, more people were hired as truck drivers, heavy & tractor-trailer, than any other occupation (5,843, or 4.5% of all new hires; see Table 1). Wyoming employers also hired an estimated 5,070 retail salespersons (3.9%) and 4,860 office clerks, general (3.8%).
This analysis includes data collected from 2010Q4 to 2011Q3 and is intended to give an overview of the types of jobs that were filled during that time by industry and region.
Methodology and Prior Research
The New Hires Survey collects information about newly hired employees in Wyoming (Knapp, 2011). This information includes duties, wages and benefits, necessary licenses or certifications, and job skills. A new hire is defined as an employee who has not worked for a particular employer since 1992 (the first year for which comparable data are available) and is used to identify what jobs are being filled across the state. The new hire job skills questionnaire is sent to a random sample of employers each quarter, and R&P has received a response rate of 70.0% or more every quarter except one. R&P has been able to use these data in a variety of ways.
Prior to the implementation of the New Hires Survey, R&P was only able to examine Wyoming's gender wage gap at the industry level. The new hires data now make it possible to see if Wyoming employers are offering the same wages and hours to males and females working in the same occupation. Glover (2011) examined the first year of data (2009Q4 to 2010Q3) and analyzed 184 occupations for which new workers were hired. Of those, males were paid significantly more in 31 occupations, while females were paid significantly more in 9 occupations. There was no significant difference in pay in the remaining 144 occupations.
New hires data were also used in conjunction with other surveys and databases to provide an in-depth analysis of Wyoming's manufacturing industry. Data collected from the New Hires Survey illustrated that even during an economic downturn, such as the one Wyoming experienced in 2009, employers continue to hire new workers. Even though total employment in the manufacturing industry decreased each year from 2008 to 2010, employers added 2,568 new hires from 2009Q4 to 2010Q3 (Moore, 2011). Information collected through the New Hires Survey was linked to R&P's Wage Records database to examine turnover in manufacturing. Of those 2,568 new hires, 77.0% were still employed one quarter after hire.
More information about the methodology used for this survey and the full results can be found online at http://doe.state.wy.us/LMI/newhires.htm.
New Hires by Industry
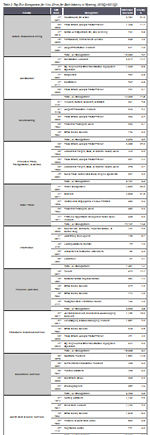 |
The largest percentage of new hires were employed by businesses in the leisure & hospitality industry (28,534, or 22.1%; see Table 2). Of those, an estimated 4,072 (14.3%) were maids & housekeeping cleaners, an estimated 3,122 (10.9%) were combined food preparation & serving workers, and an estimated 2,879 (10.1%) were dishwashers.
Of the new hires, 14.8% (19,157) were employed in the retail trade industry. A quarter of these (4,835, or 25.2%) worked as retail salespersons and more than one-fifth (4,030, or 21.0%) worked as cashiers. An estimated 682 new hires (3.6%) in this industry were employed as merchandise displayers & window trimmers.
Of the total new hires, 11.0% (14,238) worked in the construction industry. An estimated 2,519 (17.7%) of these new hires in this industry worked as construction laborers, and an estimated 1,260 (8.8%) worked as operating engineers & other construction equipment operators. In this industry, 969 carpenters (6.8%) were hired.
An estimated 9.7% (12,583) of new hires were employed by businesses in the natural resources & mining industry. Roustabouts, oil & gas, made up 2,704 (21.5%) of these. Another 11.9% (1,493) of new hires in this industry were truck drivers, heavy & tractor-trailer, and 5.8% (734) worked as service unit operators, oil, gas, & mining.
New Hires by Region
|
As noted earlier, new hires data are now available for Wyoming's substate regions. More new hires were added in Wyoming's southwest region (28,769, or 22.2%) than in any other region in the state (see Table 3; due to rounding, there are only 129,353 new hires accounted for in this table). Of these, an estimated 6.3% (1,820) worked as truck drivers, heavy & tractor-trailer, and approximately 5.2% (1,485) were cashiers. An estimated 1,142 roustabouts, oil & gas (4.0%) were hired in this region.
An estimated 20,714 new hires (16.0%) were employed in the northeast region. Of those, 5.2% (1,073) worked as truck drivers, heavy & tractor-trailer. Another 3.6% (756) worked as retail salespersons and 754 (3.6%) new hires were roustabouts, oil & gas.
An estimated 14.9% of new hires (19,278) worked in the northwest region. Approximately 4.2% (814) of these were maids and housekeeping cleaners and approximately 3.6% (694) were truck drivers, heavy & tractor-trailer. An estimated 3.5% (675) of new hires in this region were bartenders.
The 17,034 new hires employed in the central-southeast region of the state accounted for 13.2% of all new hires. Of these, an estimated 1,095 (6.4%) worked as maids & housekeeping cleaners. An estimated 894 (5.2%) new hires worked as cashiers, and an estimated 653 (3.8%) new hires worked as waiters & waitresses.
The 18,483 new hires in the Casper metropolitan statistical area (MSA), accounted for 14.3% of all new hires in Wyoming. Of those, an estimated 1,032 (5.6%) worked as office clerks, general, and an estimated 787 (4.3%) were hired as retail salespersons. There were 676 (3.7%) truck drivers, heavy & tractor-trailer, hired in this region.
There were 15,194 new hires employed in the Cheyenne MSA which accounted for 11.7% of the state's total. Of those, approximately 5.0% (753) were retail salespersons. An estimated 4.0% (612) were office clerks, general, and 3.7% (561) were truck drivers, heavy & tractor-trailer.
An estimated 9,881 (7.6%) new hires could not be placed into any particular region and made up the balance of state in Table 3. Of those, an estimated 581 (5.9%) worked as retail salespersons, 5.2% (513) worked as truck drivers, heavy & tractor-trailer, and an estimated 3.8% (372) were cashiers.
Occupations by Industry and Region
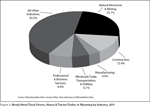 |
Another way to use the new hires data is to look at how a single occupation is dispersed across industries or regions. For example, Figure 2 shows the proportion of all truck drivers, heavy & tractor-trailer, hired in each industry. As expected, the largest proportion of truck drivers was hired by businesses in the natural resources & mining industries (25.6%), followed by the construction industry (12.4%).
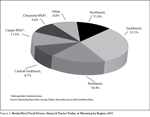 |
Figure 3 shows how these same truck drivers were employed across state planning regions. As expected, the largest proportions of truck drivers were found in the Southwest region (31.1%) and in the Northeast region (18.4%), as those are the two regions with the highest proportion of energy production-related jobs. In comparison, only 11.9% of truck drivers were hired by employers in the Northwest region of the state and 8.7% were employed in the Central-Southeast region.
More on New Hires
Research & Planning has collected two full years' worth of data on Wyoming new hires. The first year of data covers 2009Q4 through 2010Q3, when Wyoming was in the midst of an economic downturn. The most recent data cover 2010Q4 through 2011Q3, when the state began to recover from this downturn. A future article will compare and contrast these two periods.
Additional articles will look at other aspects of the jobs for which people have been hired, such as wages, hours worked, demographics, turnover, and more.
The data gathered through the New Hires survey are available online at http://doe.state.wy.us/LMI/newhires.htm.
Research Analyst Lisa Knapp can be reached at (307) 473-3835 or lisa.knapp@wyo.gov.
References
Glover, T. (2011). Examining the gender wage gap among new hires in Wyoming's manufacturing industry. Wyoming Labor Force Trends, 48(8). Retrieved June 7, 2012, from http://doe.state.wy.us/LMI/trends/0811/a1.htm
Moore, M. (2011). New hires and occupational projections in Wyoming's manufacturing industry. Wyoming Labor Force Trends, 48(6). Retrieved June 7, 2012, from http://doe.state.wy.us/LMI/0611/a2.htm
Knapp, L. (2011). New hires in Wyoming: an in-depth analysis. Wyoming Labor Force Trends, 48(2). Retrieved June 18, 2012, from http://doe.state.wy.us/LMI/0211/a1.htm