
Examining Wage Progression in Wyoming
from 1992 to 2011
See Related Tables and Figures
From 1992 to 2011, the average annual wage for Wyoming men, women, and nonresidents increased at various levels in terms of nominal dollars. But did Wyoming workers experience an increase in wages in real terms from 1992 to 2011? This analysis will answer that important question.
Introduction
Much of the previous research on wage differences between gender and age groups has focused on the wage difference at a point in time, or nominal wages over time. This analysis examines the changes in wages from 1992 to 2011 in nominal (non-inflation adjusted) and real (inflation adjusted) terms. This study initially defines nominal and real wages, then proceeds to examine factors that influence wage progression, such as economic conditions, the demographics of Wyoming's workforce, and education and work experience.
Economic Conditions in Wyoming from 1992 to 2011
The common measure of total economic output is the gross domestic product (GDP), which is the value of all goods and services produced within a given region. The term gross state product (GSP) is often used at the state level.
 |
Figure 1a displays the gross state product for Wyoming (U.S. Bureau of of Economic Analysis) and total employment over the time period (U.S. Bureau of Labor Statistics). Gross state product is only charted from 1997 to 2011 due to a change in methodology in 1997. Statistical analysis concluded that the relationship between the gross state product and total employment is positive and highly correlated. This relationship demonstrates that, generally, changes in gross state product will be strongly correlated with changes in employment. There are exceptions, such as an industry that has become more automated over time so that fewer workers have been needed to achieve a similar amount of output. Although total employment increased from 2010 to 2011, gross state product continued to decrease through 2011. Many factors contributed to this, including a drop in natural gas prices (U.S. Energy Information Administration, 2012) and a still relatively weak construction sector.
 |
From 1992 to 2011, Wyoming experienced two significant periods of economic downturn, which are periods of declining gross state (or domestic) product. An economic downturn also can be defined as "a period when the annual UI (Unemployment Insurance) benefit expenses exceed annual UI tax collection, and the UI trust fund balance declined for two years or more" (Wen, 2011). Two such periods of economic downturn occurred in Wyoming, from 2002 to 2003 and from November 2008 through January 2010. During each of these periods, the rate of increase in employment was lower than the overall trend (see Figure 1b). Wyoming also experienced a period of rapid economic expansion from February 2005 to October 2008. During this time, employment increased at a much greater rate than the overall trend. Total employment peaked in October 2008 at 300,400, and still has not returned to that level.
Methodology
Definition of Wages
Wages in this study include all gross wages including overtime, shift differential payments, holiday pay, and bonuses. The average annual wage and demographic data were obtained from "Earnings in Wyoming, 1992-2011 by County, Industry, Age, & Gender" which is available online at http://doe.state.wy.us/LMI/earnings_tables/2012/index.htm. A limitation of this study is that the number of hours worked is not available. Therefore, pay rate per hour cannot be calculated, so it is unknown if a given worker was part-time or full-time and whether overtime or shift differentials affected workers' earnings.
Consumer Price Index
When comparing dollar amounts across time periods, some form of price index is commonly used to transform the data into a common unit of measurement, such as the value of a dollar in 1992. While there are several possible price indices available for use in analysis, the Consumer Price Index for all urban consumers (CPI-U) is the one most frequently used and was used in this study (U.S. Bureau of Labor Statistics).
 |
Table 1 displays the CPI-U from 1982 to 2011. The base time period for the original index was 1982-1984 (the index = 100). The base year can be changed to any given year in the data series. If a researcher chose to use 1992 as the base year, then the researcher would divide the CPI index for all years in the series by the original index value for 1992 (140.3). Therefore, 1992 is the new base year at 100.0 and all other years are indexed to 1992; for example, 2011 has an index value of 160.3.
Nominal vs. Real Dollars
What are nominal and real values?
- Nominal
- The value of an economic variable in terms of the price level at the time of its measurement; or, unadjusted for price movements.
- Real
- The value of an economic variable adjusted for price movements.
Source: Federal Reserve Bank of Dallas. (N.D.). Deflating Nominal Values to Real Values. Retrieved December 6, 2011.
Nominal dollars are those for which inflation has not been taken into account. For example a worker may earn an average annual wage of $30,000 in 1992 and $40,000 in 2011. Nominally, the worker is earning $10,000 more a year.
Real dollars are adjusted for inflation. From the example above the worker is making $10,000 more per year by 2011. However, is the worker making higher wages once inflation is taken into account? The answer is no. The worker may be making $40,000 in 2011 dollars; however, this is only worth approximately $24,953 in 1992 dollars ($40,000/[160.3/100] = $24,953). The worker would have to make $48,900 in 2011 to have the purchasing power that $30,000 had in 1992.

|
Using nominal versus real dollars can make an enormous difference over long periods of time. For example, Figure 2 shows the top grossing U.S. films of all time in both nominal and real dollars (Silver, 2010). Because these lists are usually produced in nominal terms, these lists are biased toward newer movies because movie ticket prices have increased over time. In nominal dollars, the 2009 film "Avatar" is the top grossing movie of all time ($749 million). However, there are several other factors to consider when determining the top grossing film of all time in real dollars, such as ticket prices, number of theaters, economic conditions at the time of the release, length of release, population at the time of release, and more. Accounting for inflation, the top grossing movie of all time is "Gone With the Wind," which was made in 1939 and grossed $1.6 billion domestically in real dollars.
As this example demonstrates, using nominal versus real dollars can greatly affect any analysis. When discussing the need to examine economic issues over time, it is appropriate to discuss the issue in terms of real dollars in addition to, or in place of, nominal dollars.
Results
Gender and Industry
 |
The demographic composition of Wyoming's workforce varies by industry. Industries such as natural resources & mining, manufacturing, and wholesale trade, transportation, & utilities have a high percentage of male workers, while industries such as educational services and health care & social assistance have a high percentage of female workers. In addition, Wyoming employers provide jobs to a large number of nonresident workers for whom demographic information is not available. The distribution of these nonresidents varies greatly across industries, with the highest proportion of nonresidents working in construction, leisure & hospitality, and natural resources & mining (see Figure 3).
Jones (2002) found that from 1992 through 2001, women worked an average of 17.7 quarters in Wyoming while men averaged 18.1. Nonresident workers averaged only 1.7 quarters, of which the author stated, "the small number of average quarters worked suggests that workers in this group are highly mobile and marginally attached to the Wyoming labor market."
Experience and Education by Industry

|

|
The amount of experience an individual has in a particular industry is an important factor in determining the magnitude of wage progression over time. Experience within an industry tends to lead to raises, promotions, and greater mobility, contributing to a higher wage progression. Table 2 presents the number of individuals within an industry in 2011 and the average, median (the midpoint of a data series), and modal (most occurring number of a data series) quarters of experience within a particular industry.
Educational services and public administration had the highest average (31.5 and 29.9, respectively) and median (22.0 and 21.0, respectively) quarters of experience of all industries. Educational services and public administration had the highest modal quarters of experience with 80.0 each. All other industries had only 1.0 or 2.0 modal quarters of experience. Industries that offered higher wages tended to have higher rates of experience within that industry.
The industries that showed the highest levels of experience were also the industries with the highest percentage of jobs that required more than a high school diploma. Of all jobs in educational services, 77.5% required more than a high school diploma, as did 62.8% of all jobs in public administration (see Table 3). It is important to understand that experience is a measurement of the persons working, while educational requirements are a measurement of the jobs worked.
Wage Progression
 |
 |
Table 4 displays the change in average annual wages in nominal and real dollars by industry from 1992 to 2011. Assuming the CPI-U is a relatively accurate proxy for inflation in Wyoming, real wages increased across all industries from $14,923 in 1992 to $20,096 in 2011, an increase of 1.7% per year. The two industries that gained the most wages in real terms per year were public administration (2.5%) and leisure & hospitality (2.2%), followed closely by manufacturing (2.1%) and health care & social assistance (2.0%). Interpreting percentage changes should be conducted with caution as these changes are very sensitive to the base (in this case, wages in 1992). For example, leisure & hospitality shows a large percentage increase over this period, but that is due to the fact that it had the smallest base of any industry ($4,741 in 1992).
Table 5 separates the 1992-2011 period into three groups: one of relatively stable economic growth (1992-2004), a growth period greater than the overall trend (2005-2008), and the subsequent economic downturn and the beginning of an economic recovery (2009-2011).
A negative percentage change in real wages indicates that wages are not keeping up with the rate of inflation and therefore, the purchasing power of an individual has lessened even though their wages have increased nominally. For example, from 2009 to 2011, nominal wages in public administration increased at a rate of 1.2% per year; however, in real terms, the wages in this sector decreased at a rate of 0.4% per year.
Across all industries, wage progression in real wages per year was highest in the 2005-2008 period (3.1%) followed by 1992-2004 (1.0%), with 2009-2011 exhibiting the lowest increase (0.5%). These results conform to standard economic theory, which suggests when the economy is expanding at a rapid rate, employers are inclined to pay higher wages to entice workers with skills in high demand. Individual industries generally followed that same pattern.
Several industries demonstrated a drop in wages in real terms between 2009 and 2011. Construction had the largest decrease of 1.2% per year; in addition to this drop in real wages, employment in the construction industry decreased by 7,300 jobs (-26.0%) from 2008 to 2011 (U.S. Bureau of Labor Statistics). Decreasing real wages could also simply reflect employees working fewer hours.

|

|
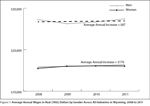
When comparing the increase in nominal wages to the increase in real wages, the rate of increase is slower in real wages. Figure 4 shows the nominal and real wages for all industries over the time period with a linear regression line (trend line) representing the average annual increase. The purpose of the regression equations is to examine the increase in wages per year. From 1992 to 2011, nominal wages increased by approximately $972.85 on average per year. By deflating wages using the CPI, the change in real wages is approximately $325.48 per year. From 1992 to 1996, real annual average wages decreased. From 1997 to 2011, real wages increased at varying rates. The largest year-to-year increase in real wages ($952) occurred from 2005 to 2006, while the smallest increase ($43) occurred from 2010 to 2011.
Figure 5 displays the real wages (in 1992 dollars) for selected industries from 1992 to 2011. The average annual change for each industry is shown by using a linear trend line. The linear trend equation for two industries (natural resources & mining and retail trade) is shown in Figure 4. Wages for the natural resources & mining industry ($454 per year) have increased at a faster rate than all other industries, while retail trade ($114 per year) has had the slowest rate of wage increase.
Wages by Gender and Industry
Across all industries, women were paid 51.2% of the average annual wage for men in 1992 and 58.5% in 2011. During Wyoming's recent economic downturn, the wage gap narrowed and the average annual wage for women was 61.1% of the average annual wage for men (Moore, 2012). As Wyoming began to recover from the economic downturn, the wage gap once again began to widen.
 |
 |
If the trends from 1992 to 2011 continue, the wage gap will continue to widen rather than narrow (see Figures 6a and 6b). The real average annual wage for men is increasing at $426 per year while only increasing at $338 per year for women. Nonresidents generally have a lower average annual wage than residents due largely to the lower number of quarters worked (Jones, 2002).
|
While men's wages have grown faster than women's wages, the dynamics of wage progression changed during the economic downturn (see Figure 7). From 2008 to 2011, the increase in the average annual wage for women ($176) was greater than the increase in the average annual wage for men ($87). At least part of this change can be explained by the industry/gender composition and the impact of the economic downturn on the various industry sectors. For example, Figures 8a and 8b demonstrate the employment levels in construction, which has a high percentage of male workers, and health care & social assistance, which has a high percentage of female workers. Figure 8a shows that employment in the construction industry dropped considerably (14,900 jobs) and was much more volatile from 2008 to 2011 than the health care industry. Figure 8b illustrates that employment in health care & social assistance increased by 1,733 jobs over the same period.
 |
 |
Changes in economic conditions affect the number of workers in a given industry and the number of hours worked, and therefore will change the dynamics of wage progression.
Wage Progression by Industry
The average annual wage for women increased at a faster rate than the average annual wage for men in five industries. Of these, three had a significantly higher rate of wage progression for women than men: retail trade, information, and public administration. However, while the wage increase was greater for women, men were paid a higher average annual wage. If these trends continue, it would take a minimum of 83 years for women to catch up to men in any of these three industries. The rates of wage progression for both genders will continue to change. One possible approach to closing a gender wage gap within an industry would be to change the occupational mix of genders by promoting public and private training programs.
Wages by Age Groups

|
Wages have progressed fairly consistently from 1992 to 2011, with older workers generally paid more than younger workers across all industries (see Figure 9). The 45-54 and 55-64 age groups historically have had the highest average annual wages, while workers under age 20 have had the lowest. These results tend to be the same within individual industries, although there is variation in the magnitude of wage differences between age groups depending on the industry.
This analysis examined wage progression by age group in order to determine how the earnings of one age group compared to the real dollars of that age group in 2011. The data used for this article can also be used to examine the wage progression of workers in a particular age group over time. For example, the wages of those under age 20 can be tracked to see how they changed over time. This may be a future avenue of research for R&P.
Conclusion
Many factors influence the dynamics of wage change over time. Changes in economic conditions from the overall trend lead to changes in the number of workers employed, hours worked, and wage per hour. Experience within an industry and the minimum educational requirements also have an impact on average wages and the magnitude of wage progression.
In Wyoming, real annual wages increased in all industries from 1992 to 2011. The average annual wage for women increased from 51.2% of the average annual wage for men in 1992 to 58.5% in 2011. This increase is primarily due to changes in employment due to the most recent economic downturn and the subsequent period of recovery. Women were less likely to lose jobs than men during this period, and employment in health care & social assistance even increased. Much of this is due to the high proportion of men employed in industries that shed jobs during the economic downturn, such as construction.
The results of the annual average wage by age group analysis are consistent with previous research conducted in Wyoming. The 45-54 and 55-64 age groups earned the highest wages while those in the under age 20 group earned the lowest.
References
Jones, S. (2002). Defining residency for the Wyoming workforce. Wyoming Labor Force Trends, 39(11). Retrieved August 7, 2012, from http://doe.state.wy.us/LMI/1102/a1.htm
Moore, M. (2012). Wyoming employment grows from 2010 to 2011. Wyoming Labor Force Trends. 49(6). Retrieved September 5, 2012, from http://doe.state.wy.us/LMI/trends/0612/a3.htm
O*NET OnLine. Retrieved September 5, 2012, from http://www.onetonline.org/
Research & Planning, Wyoming Department of Workforce Services. Earnings in Wyoming, 1992-2011 by County, Industry, Age, & Gender. Retrieved August 2, 2012, from http://doe.state.wy.us/LMI/earnings_tables/2011/industry.htm
Research & Planning. Wyoming Department of Workforce Services. (2011). Wage Records database. Unpublished raw data.
Silver, T. (2010). The actual top grossing U.S. movies. Investopedia. Retrieved September 5, 2012, from http://www.investopedia.com/financial-edge/0610/The-Actual-Top-Grossing-US-Movies.aspx
U.S. Bureau of Labor Statistics. Consumer Price Index. Retrieved September 5, 2012 from http://bls.gov/cpi/.
Employment, Hours, and Earnings - State and Metro Area (Current Employment Statistics). Retrieved August 27, 2012, from http://www.bls.gov/data/#employment
U.S. Census Bureau. North American Industry Classification System. Retrieved September 5, 2012, from http://www.census.gov/cgi-bin/sssd/naics/naicsrch?chart=2012
U.S. Energy Information Agency (EIA). Natural Gas Futures Contract 1. Retrieved September 5, 2012 from http://www.eia.gov/dnav/ng/hist/rngc1d.htm
Wen, S. (2011). An overview of Wyoming's unemployment insurance trust fund and trust fund liability. Wyoming Labor Force Trends, 48(11). Retrieved September 5, 2012, from http://doe.state.wy.us/LMI/trends/1111/a1.htm
Wyoming Economic Analysis Division. Wyoming gross state product by industry (NAICS): 1997 to 2010 (nominal dollars). Retrieved September 5, 2012, from http://eadiv.state.wy.us/i&e/WyoGDP97_10.htm