

Training Needs in Wyoming's Manufacturing Industry
In May 2011, the Research & Planning (R&P) section of the Wyoming Department of Workforce Services (DWS) mailed the Manufacturing-Works questionnaire to 602 employers in Wyoming's manufacturing industry. This survey instrument was designed to find out about skills needs in Wyoming's manufacturing industry, and what types of training employers need compared to what types of training they provide. It is important to note that a survey represents a report of behavior, opinion, or point of view; it is not an observation of behavior.
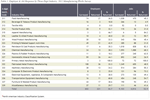
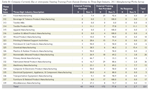
According to the U.S. Bureau of Labor Statistics (BLS), the manufacturing industry is comprised of establishments engaged in mechanical, physical, or chemical transformation of materials. The manufacturing industry is categorized by the North American Industry Classification System (NAICS) as NAICS 31-33. This includes plants, mills, and factories, and may include bakeries and tailors. In Wyoming, the largest number of manufacturing employers are fabricated metal product manufacturers (108; see Table 1), food manufacturers (74), and non-metallic mineral product manufacturing (59).
 |
 |
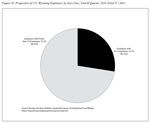 |
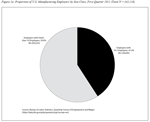
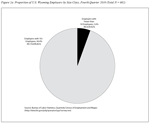
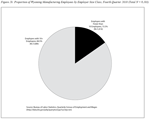
Wyoming's manufacturing industry is considerably different than that of the nation as a whole. Wyoming's manufacturers are smaller, and represent less of the gross domestic product (GDP). Nationally, in 2010, employment in manufacturing constituted 10.8% of total private sector employment but in Wyoming it only constituted 4.2% of total private sector employment. Similarly, while manufacturing made up 13.5% of the nation's 2010 GDP, it only contributed 8.6% of Wyoming's 2010 GDP (Manning, 2011). Overall, in first quarter 2011, more than half of U.S. manufacturing employers had fewer than 10 employees (59.0%; see Figure 1a) but in fourth quarter 2010, nearly three-quarters of Wyoming manufacturing employers had fewer than 10 employees (72.3%; see Figure 1b). Nationally, in first quarter 2011, only 5.6% of manufacturing employees worked for employers with fewer than 10 employees, while the other 94.4% worked for larger firms (see Figure 2a). In comparison, 15.5% of Wyoming manufacturing employees worked for firms with fewer than 10 employees in fourth quarter 2010 (see Figure 2b).
 |
 |
Research by Moore (2011) using the Wyoming New Hires survey found that half of all workers (50.9%) in the manufacturing industry work in production occupations and 43.5% of new hires fill production positions. While this research shows what kinds of jobs are worked by employees of manufacturing companies, it does not show what kind of training is needed for them. In July 2011, R&P was hired by the Manufacturing-Works program at the University of Wyoming to conduct a survey of training needs among the state's manufacturers. Three main concepts stood out during the analysis of this survey concerning issues in human resource acquisition, barriers to business expansion, and training needs. Each is discussed in turn.
Methodology
The Manufacturing-Works questionnaire (see Appendix A) was created using data from the National Association of Manufacturers. This questionnaire was sent out to all 602 employers in the state that were identified as belonging in the manufacturing industry (NAICS 31-33) in the Quarterly Census of Employment and Wages (QCEW) database during the fourth quarter of 2010. Employers may have received the questionnaire up to two times. Research & Planning mailed a first round of questionnaires with addressed and stamped return envelopes on May 23, 2011, to all employers. If they did not return a completed form, they were sent another one on June 9, 2011. Phone calls were made to non-responding employers between June 23-28, 2011, in an effort to improve the survey response rate.
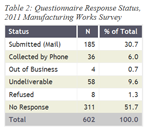 |
Unfortunately, the timing of the project did not permit the normal address and firm contact refinement that would have allowed R&P to improve the quality of the contact information. Of the 602 questionnaires that were mailed to employers, 185 (30.7%; see Table 2) were completed and returned, and another 36 (6.0%) were collected over the telephone. Slightly more than one in 10 questionnaires were undeliverable due either to insufficient address information (58, or 9.6%) or business closure (4, or 0.7%).
 |
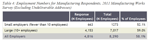 |
Eight employers refused to participate (1.3%) and half of the questionnaires sent out (311, or 51.7%) were never returned. Businesses with insufficient address information and closures were removed from the original pool because no useable data could be collected from them, which left a net response rate of 40.9%. Larger employers (those with 10 or more positions) had a higher response rate at 42.5% than smaller employers with fewer than 10 positions (40.3%; see Table 3). However, as shown in Table 4, more than half (58.1%) of manufacturing jobs were represented. The larger employers who responded represented 59.0% of the jobs among all employers with 10 or more jobs; the smaller employers who responded represented 52.1% of the jobs among all employers with fewer than 10 jobs.
A 40.9% response rate is considered very low, especially by R&P's standards. Responses were captured for employers of nearly 60% of manufacturing employment but, unfortunately, with a low response rate such as this the results cannot be generalized to all manufacturing employers. The lack of response to this survey may be explained by the questionnaire content. Many of the questions were modeled after those used by the National Association of Manufacturers, but as was discussed in the comparison of the size of manufacturing employment relative to the U.S., comparison of firm size and contribution to the GDP do not seem to be applicable to the small employers that make up much of Wyoming's manufacturing base.
This study should be viewed almost as a pre-test. There was not enough time to work directly with employers, especially smaller employers, to determine what economic questions were relevant to them. Based on the response patterns in this round of the survey, there are distinct differences between larger and smaller employers. A greater proportion of large employers responded to questions about the various types of training, probably because they employed enough people to offer training on a large scale. Many smaller employers did not reply to any of the training types listed on the questionnaire. Based on discussions with employers during telephone interviews, R&P can propose a number of reasons: they are a family-run business, they are only open a few months per year (as is the case with many meat processing companies in the state), or they simply do not employ enough people to justify the time and money required to provide formal training. That is not to say that workers at these companies do not receive training of some sort; they just do not receive it in the ways presented in the survey instrument. Time spent with smaller employers in the form of focus groups and one-on-one interviews would help clarify what issues they would like to see included in survey research.
Analysis
 |
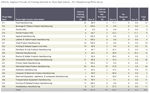
Overall, 36.7% of manufacturing employers responded, representing 52.9% of manufacturing jobs (see Table 1). Table 5 shows the estimated employment by occupation for all employers. This table was calculated using a staffing pattern created from the Occupational Employment Statistics (OES) program, a representative survey of each industry to obtain staffing patterns and wages. More information on OES can be found at http://doe.state.wy.us/LMI/oes.htm. Occupations are grouped together using the Standard Occupational Classification (SOC) System; see http://www.bls.gov/soc/ for more information.
The OES program was used to determine the typical ratio of employment by occupation at a three-digit industry level. This ratio was then applied to employees working for the employers that responded to the survey. For example, if the staffing pattern from OES for food manufacturing (NAICS 311) showed that 50% of jobs were typically found in production occupations and an employer classified in this NAICS group had 30 positions, 15 jobs would be added to the production row of the table.
As shown in Table 5, the columns under "employers with each occupation" contain the number of employers that, according to the staffing pattern, had jobs in each type of occupation and the number of employers with each occupation that responded to the survey. Almost all manufacturing employers had production positions (SOC 51; 601 employers), office & administrative support positions (SOC 43; 601), and management & financial operations positions (SOC 11-13; 588 employers). Not as many had positions in computer & mathematical occupations (SOC 15; 246 employers), food preparation or building & grounds cleaning & maintenance occupations (SOC 35-37; 358 employers), or healthcare practitioners & technical occupations (SOC 29; 204 employers). Approximately one-third of employers with each type of occupation responded. For example, of the 601 employers with production jobs (SOC 51), 221 (36.9%) responded.
The columns under "jobs in each occupation" contain the estimated number of jobs in each occupation according to the staffing pattern, and the number of jobs represented by responding employers (see Table 5). There were an estimated 4,623 production jobs (SOC 51) in the state and employers of just over half (52.2%) returned a questionnaire. Of the estimated 570 management & financial operations jobs in the state (SOC 11-13), half (52.2%) worked for an employer that returned a questionnaire, and of the 988 transportation & materials moving jobs (SOC 53), 39.4% were represented by responding employers.
Human Resource Acquisition Strategies
 |
Employers were asked to indicate how useful they thought different human acquisition strategies were to their hiring practices. Table 6 shows the proportion of respondents who indicated each strategy was "very useful" for hiring by three-digit industry. Word of mouth was considered to be a very useful hiring strategy by the largest proportion of responding employers (64.7%). Of the 27 food manufacturers (NAICS 311) that responded to the survey, 74.1% thought this strategy was very useful. Similarly, 75.0% of the 36 respondents in fabricated metal products manufacturing (NAICS 332) and 69.2% of the machinery manufacturing respondents (NAICS 333) noted that this was a very useful strategy for hiring.
Approximately one-fifth (20.4%) of responding employers thought newspaper job vacancy ads were very useful (see Table 6). The largest proportion of these were in plastics & rubber manufacturing (NAICS 326; 50.0%), transportation equipment manufacturing (NAICS 336; 45.5%), and chemical manufacturing (NAICS 325; 38.5%). Another one in five (21.3%) responding employers felt the DWS local offices were very useful for hiring employees. Just under one-third (29.4%) of the 17 respondents in furniture & related product manufacturing industry (NAICS 337) and 36.1% of the 36 employers in the fabricated metal product manufacturing industry (NAICS 332) felt this way.
Only 1.8% of employers thought local career fairs were very useful for hiring employees (Table 3). Those employers were in chemical manufacturing (NAICS 325; 7.7%), primary metal manufacturing (NAICS 331; 33.3%), transportation equipment manufacturing (NAICS 336; 9.1%), and miscellaneous manufacturing (NAICS 339; 9.1%). Only 1.4% of employers found work readiness certificates from DWS to be useful, as well. These employers were in electrical equipment, appliance, & component manufacturing (NAICS 335; 20.0%), primary metal manufacturing (NAICS 331; 33.3%), and nonmetallic mineral product manufacturing (NAICS 327; 3.8%).
Barriers to Business Expansion
 |
In addition to human resource acquisition strategies, employers were asked to rate how important they felt several potential barriers were to expanding their businesses. As shown in Table 7, the barrier considered very important by the largest proportion of employers was the cost of health insurance (51.6%). More than half of employers in 12 manufacturing subsectors felt this way, including those in transportation equipment manufacturing (NAICS 336; 72.7%), printing & related support activities (NAICS 323; 52.4%), and fabricated metal manufacturing (NAICS 332; 69.4%).
A skills shortage was considered a barrier to expansion by 38.5% of employers. Nearly three-quarters (72.7%) of employers in transportation equipment manufacturing (NAICS 336) and 52.8% of fabricated metal product manufacturers (NAICS 332) said this was a very important barrier to business expansion. Only 10.0% of wood product manufacturers (NAICS 321) said it was very important to expansion.
Another 38.9% of manufacturers indicated that non-fuel manufacturing input costs were a very important barrier to expansion. More than one-third of employers in 13 manufacturing subsectors felt this way, including those in fabricated metal product manufacturing (NAICS 332; 47.2%), transportation equipment manufacturing (NAICS 336; 54.5%), and nonmetallic mineral product manufacturing (NAICS 327; 42.3%).
Training
Employers were asked whether or not their companies provided all their training internally or if they anticipated needing training from outside providers. Because these questions were asked independently of each other, an employer could answer yes to each, no to each, or yes to one or the other.
 |
As shown in Table 8a, 81.0% of employers said they provided all of their training internally. This was the case for more than three-quarters of employers in 12 manufacturing subsectors, including food manufacturing (NAICS 311; 88.9%), printing & related support activities (NAICS 323; 90.5%), and furniture & related product manufacturing (NAICS 337; 100.0%). Smaller proportions of manufacturers in chemical manufacturing (NAICS 325; 46.2%) and textile product mills (NAICS 314; 66.7%) indicated they offered internal training.
 |
The proportions of employers that said they have or anticipated having a need for training from outside entities are shown in Table 8b. A much smaller proportion of employers (19.5%) indicated needing outside training. Included in those that said yes were 28.6% of those in printing & related support activities (NAICS 323), 38.5% of those in chemical manufacturing (NAICS 325), and 26.9% of those in nonmetallic mineral product manufacturing (NAICS 327).
One of the main purposes of this survey was to identify the types of training employers offered their workers and what may be needed. Employers were presented with several types of training, ranging from leadership skills to safety training and were asked to indicate by occupational group whether the training was offered by the company, or not offered but needed. They could also leave a blank if they felt neither option applied or they did not have jobs in a particular occupation (see Appendix). As with Table 5, an occupational staffing pattern was created for the three-digit level of the manufacturing industry and used to estimate the number of jobs in each occupation that were offered training or needed training. The percentages in each row of these tables refer to the percentage of jobs in each occupation that need each type of training and do not add up to the total percentage. For example, 45.0% of jobs in management may need a type of training, but only 20.0% of all jobs need that type of training.
 |
Table 9a contains the number of employers and the estimated number of jobs that needed leadership skills training. An estimated 424 jobs in 49 companies (9.1%) needed basic supervisory training. Of those, 52 jobs in 32 companies (16.4%) were in management or financial operations positions (SOC 11-13) and 198 jobs in 15 companies (8.2%) were in production occupations (SOC 51).
The type of leadership training needed by the largest proportion of jobs was problem solving and decision making (694, 14.9%; see Table 9a). Approximately 75 jobs in 12 companies (17.6%) in transportation & moving materials occupations (SOC 53) needed this type of training, as did 413 production jobs in 16 companies (SOC 51; 17.3%) did. Only an estimated two sales & related jobs in 9 companies (SOC 41; 2.4%) needed this type of training.
Similarly, approximately 657 jobs in 35 companies (14.1%) needed training for training and coaching skills. Of these, an estimated 72 jobs in 8 companies (16.8%) were in transportation & materials moving occupations (SOC 53), 405 jobs in 15 companies (16.9%) were in production occupations (SOC 51), and 109 jobs in 10 companies (17.5%) were in construction; extraction; or installation, maintenance, & repair occupations (SOC 47-49).
 |
The estimated number and proportion of jobs that provided leadership training are displayed in Table 9b. The largest proportion of jobs (1,893, 40.6%) were provided with basic supervisory training. Of those, an estimated 211 jobs in 76 companies (67.2%) were in management or financial operations occupations (SOC 11-13) and an estimated 1,098 jobs in 81 companies (45.9%) were in production occupations (SOC 51).
An estimated 1,349 jobs in 73 companies (29.0%) received cross training in gender equity. Of those, 873 were production jobs from 49 companies (SOC 51; 36.4%), 168 were transportation & materials moving jobs from 24 companies (SOC 53; 39.3%), and 87 were management & finance jobs in 48 companies (SOC 11-13; 27.7%). Another quarter of jobs (1,196; 25.7%) were provided with training in managing productivity. Among those were 132 jobs from 64 companies (41.9%) that worked in management & financial operations occupations (SOC 11-13) and 28 jobs from 45 companies that were in sales & related occupations (SOC 41; 33.6%).
 |
Table 10a contains the number and proportion of jobs that needed computer-aided manufacturing training. A select few manufacturing firms with 10 or more positions were asked to complete this question (44). Only 390 jobs in 7 of these firms (12.7%) needed computer-aided design training. Of those, 29 jobs in 5 companies (13.5%) were in management & financial operations occupations (SOC 11-13), 88 jobs in 2 companies (16.6%) were in construction; extraction; or installation, maintenance, and repair occupations (SOC 47-49), and 252 jobs in 3 companies were production workers (SOC 51; 17.3%).
 |
The estimated number and proportion of jobs that were provided with computer-assisted manufacturing training are shown in Table 10b. Office production software training was provided for 743 jobs in 19 companies (24.2%). This training provided for 109 management & finance jobs in 12 companies (SOC 11-13; 50.5%) and 85 architecture, engineering, & science jobs in 4 firms (SOC 17-19; 37.4%).
Computer integrated production management training was provided for 608 jobs in 10 firms (19.8%; Table 10b). An estimated 88 jobs in 4 firms (38.6%) were in architecture, engineering, or sciences occupations (SOC 17-19) while 308 jobs in 7 firms (21.1%) were in production occupations (SOC 51). Approximately 493 jobs in 15 firms (15.8%) were provided with computer-aided design training. Of these, 90 jobs in 6 firms (39.7%) were in architecture, engineering, & sciences occupations (SOC 17-19).
 |
All employers were asked to indicate which jobs needed safety training. As shown in Table 11a, employers reported that a comparatively small proportion of jobs needed these types of training compared to leadership training. Only an estimated 129 jobs in 22 firms (2.8%) needed injury and illness prevention training, and of those, 114 were production jobs in 13 firms (SOC 51; 4.8%). An estimated 129 jobs in 19 firms (2.8%) needed OSHA or regulatory training and, again, a majority were production workers (SOC 51; 118, 4.9%). Approximately 117 jobs in 14 companies (2.5%) needed equipment safety training and 107 jobs in 13 companies (2.3%) needed confined space entry training.
 |
All employers were asked to indicate if they provided safety training to their employees (Table 11b). More than half of the jobs were provided with each type of safety training. An estimated 2,878 jobs in 150 companies (61.8%) were provided with equipment safety training. Of those, 1,893 production jobs in 127 firms (SOC 51; 79.1%) and 194 management or finance jobs in 70 companies (SOC 11-13; 61.7%) were provided with this training. Approximately 2,848 jobs in 119 firms (61.1%) were provided with OSHA or regulatory training. Of those, 1,795 jobs in 97 firms were production workers (SOC 51; 75.0%), 190 jobs in 52 firms were in transportation & materials moving occupations (SOC 53; 44.6%), and 362 jobs in 54 firms (58.0%) were in construction; extraction; or installation, maintenance, & repair occupations (SOC 47-49).
 |
A small selection of employers with 10 or more positions (44) were also asked to indicate what types of quality assurance training were needed for those jobs (Table 12a). An estimated 484 jobs in nine firms (10.6%) needed training in process improvement techniques. Of these, 350 jobs in seven firms (14.6%) were production occupations (SOC 51) and 90 jobs in seven firms (14.6%) were construction; extraction; or installation, maintenance, & repair workers (SOC 47-49).
Only 49 jobs in four companies (1.1%) needed statistical process control training, mainly in computer & mathematical occupations (SOC 15; 10, or 33.1%). Approximately 494 jobs in nine firms (10.8%) needed job planning and scheduling training, mainly among production workers (SOC 51; 309, or 12.9%) and transportation & materials moving jobs (SOC 53; 71, or 16.7%).
 |
An estimated 481 jobs in 11 firms (10.3%) were provided with statistical process control training (see Table 12b) by their employers. Of these, 84 jobs in 6 firms (26.7%) worked in management & financial operations occupations (SOC 11-13). An estimated 684 jobs in 17 firms (14.7%) were provided with organizing and maintenance operations training. The largest number of these (382, or 16.0%) worked in production occupations (SOC 51) while another 79 (12.6%) were estimated to work in construction; extraction; or installation, maintenance, & repair occupations (SOC 47-49).
Discussion
Employers reported that they relied on word of mouth more than any other human resource hiring strategy when filling positions, although they also used newspaper job vacancy advertisements and DWS local offices to fill jobs. Very few used local career fairs or DWS work readiness certificates for their hiring needs.
Half of employers said the cost of health care insurance was the most important barrier to their ability to expand their business. They also felt that the cost of non-fuel manufacturing inputs would have a negative effect on business expansion.
Overall, leadership skills had the highest reported proportions of jobs that needed training. Employers felt that nearly 15% of their jobs needed training in both training and coaching skills and in decision making and problem solving. They felt another nearly 10% of their workforce needed some type of training in basic supervisory skills. In comparison, employers felt that very few of their jobs needed any type of safety training.
References
Manning, P. (2011, June). Manufacturing industry in Wyoming small but growing. Wyoming Labor Force Trends, 48(6). Retrieved August 22, 2011, from: http://doe.state.wy.us/lmi/0611/a1.htm
Moore, M. (2011, June). New hires and occupational projections in Wyoming's manufacturing industry. Wyoming Labor Force Trends, 48(6). Retrieved August 22, 2011, from: http://doe.state.wy.us/lmi/0611/a2.htm
U.S. Bureau of Labor Statistics. (2008). Quarterly Census of Employment and Wages frequently asked questions. Retrieved September 7, 2011, from: http://www.bls.gov/cew/cewfaq.htm#Q05