
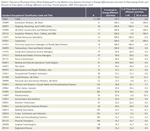
Wyoming New Hires by Industry: 2009Q4 to 2010Q3
See Related Tables
During the spring of 2010, the Research & Planning (R&P) section of the Wyoming Department of Workforce Services, along with several other state Labor Market Information offices, received funding to study the workforce, including jobs that spend time on activities that increase energy efficiency, use or develop renewable energy resources, or preserve and restore the environment. R&P designed a mail questionnaire that contained a question measuring the degree to which a job was involved in any of these energy-efficient activities and was designed to capture and assess the types of skills needed for jobs in Wyoming. Ultimately, the goal of this project is to determine what types of jobs are available in the state, which ones are likely to be energy efficient, and whether there are any significant differences between energy-efficient jobs and those that are not energy efficient.
Who is a New Hire?
A new hire is defined as someone who was hired by a firm in Wyoming for which he or she has not worked in at least the last 20 years (the period for which Research & Planning has Unemployment Insurance wage records).
Survey data come from a random sampling of more than 112,000 new hires made by Wyoming employers (excluding state government) over a four-quarter period (fourth quarter 2009 to third quarter 2010). This article primarily focuses on the 50 occupations with the greatest number of newly hired workers within the health care & social assistance industry, for purposes of examining how the data may be used.
While the values for totals by industry are informative, it is also helpful to examine characteristics of individual occupations within industries. This provides a better idea of wages and benefits a newly hired worker can expect, the typical hours worked, and other information. As an example, this article follows nursing assistants, including certified nursing assistants (CNAs) across the nine tables in this article. Data for all other industries are available online at http://doe.state.wy.us/LMI/newhires.htm.
The information presented in this article refers only to new hires. Information on all workers in Wyoming is available from the Occupational Employment Statistics program at http://doe.state.wy.us/LMI/oes.htm.
It is important to note that in Wyoming, 96 occupations require licenses, certificates, or other registration. Even though an employer may have identified a new hire as working in these licensed occupations, such as registered nurses that does not necessarily mean that person has been licensed in Wyoming. the latest Guide to Licensed Occupations in Wyoming is available at http://doe.state.wy.us/LMI/dir_lic/WY_Licensed_Occs_Fall_2011.pdf.
Methodology
For an in-depth discussion of the methodology used to create the tables, see the article “Survey Captures Data on Wyoming New Hires” in the February 2011 edition of Wyoming Labor Force Trends.
Results
Characteristics of Jobs Worked
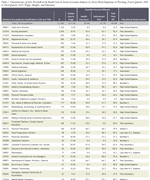 |
Table 1 shows median1 wages, benefits offered, and typical education required of newly hired Wyoming workers in the health care & social assistance industry for fourth quarter 2009 (2009Q4) through third quarter 2010 (2010Q3). The median wage for all newly hired workers in this industry was $11.00 per hour, with 35.0% offered health insurance, 31.7% offered a retirement plan, and 40.8% offered paid time off. Typical education required across occupations ranged from less than a high school diploma (e.g., food preparation workers; counter & rental clerks) to a doctorate (e.g., lawyers; clinical, counseling, & school psychologists). As a general rule, the higher the level of education or experience required for a given occupation, the higher the wage (Weiss, 1995).
Nursing assistants, Standard Occupational Classification (SOC) code 311014, earned slightly less than the median wage for all newly hired employees at $10.91 per hour (see Table 1). However, compared to the total, a higher proportion of nursing assistants were more frequently offered all three benefits, with 52.6% offered health insurance, 43.1% offered a retirement plan, and 56.9% offered paid time off. The typical education requirement for this occupation is postsecondary training.
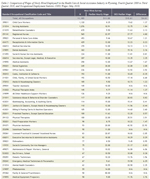 |
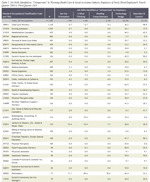
Table 2 includes median wages for newly hired workers, along with median wages as reported in the Occupational Employment Statistics (OES) May 2010 panel (for more information about the collection methods used by OES, see http://doe.state.wy.us/lmi/EDSMarch2011/intro.htm). Note that OES data include workers with a range of seniority at a given job, from the newly hired to employees nearing retirement. The new hires survey does not collect information about employees’ work experience or education. What is known is that more than half of all newly hired workers in health care & social assistance were ages 16-34. In comparison, 34.3% of all workers in health care & social assistance in 2010 were under the age of 35 (Wyoming Department of Workforce Services, Research & Planning, n.d.). On average, younger workers may have less education or experience because they have not yet had the time to acquire it. Another possibility may be that “… the educational requirement for new workers may exceed those of older workers in a given firm since inexperience needs to be compensated for by higher education” (Harmon, Oosterbeek, & Walker, 2003). In general, the median wage for all occupations was greater than for newly hired workers. This is consistent with economic theory that predicts that the more seniority a person has with a job, the higher the wages (Topel, 1991). For all occupations in health care & social assistance, the OES wage was $4.61 higher per hour. The median wage for newly hired nursing assistants was $1.84 less than the median wage for all nursing assistants.
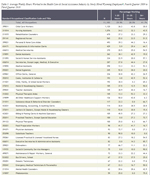 |
The average weekly hours worked by newly hired employees is found in Table 3. Among all employees, 41.7% worked 36 or more hours per week, 28.5% worked 21-35 hours per week, and 29.9% worked 1-20 hours per week. Compared to the average in the health care & social assistance industry, the percentage of nursing assistants working 36 or more hours per week was 43.5%; 32.3% worked 21-35 hours; and 24.2% worked 1-20 hours per week.
Job Skills
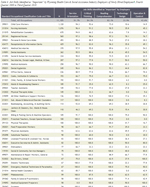 |
Table 4 describes job skills identified by Wyoming employers as “important.” The five job skills asked about on the survey were:
- Service orientation – actively looking for ways to help people;
- Critical thinking – using logic and reasoning to identify the strengths and weaknesses of alternative solutions, conclusions, or approaches to problems;
- Reading comprehension – understanding written sentences and paragraphs in work-related documents;
- Technology design – generating or adapting equipment and technology to serve user needs; and
- Operation and control – controlling operations of equipment or systems.
More than 80% of health care & social assistance industry employers identified the skills of service orientation, critical thinking, and reading comprehension (91.7%, 84.3%, and 82.1%, respectively) as important skills for all newly hired health care & social assistance industry workers. Fewer than half of the employers identified the skills of technology design and operation and control as important (33.9% and 43.6%, respectively). The responses from employers who hired nursing assistants mirrored the total, with 96.4% identifying service orientation as important, 91.2% for critical thinking, and 90.5% for reading comprehension. Technology design was ranked by 35.8% of employers as important, while 45.3% ranked operation & control as important.
 |
The five skills shown in Table 4 are also shown in Table 5, except Table 5 shows the percentage of employers who ranked the skills as unimportant. Less than 2.5% of all Wyoming employers ranked each of the skills of service orientation, critical thinking, and reading comprehension as unimportant. A larger percentage ranked technology design and operation & control as unimportant (25.0% and 23.4%, respectively). Even fewer employers of nursing assistants ranked service orientation, critical thinking, and reading comprehension as unimportant. In fact no employers of newly hired nursing assistants ranked critical thinking and reading comprehension as unimportant, and just 0.7% ranked service orientation as unimportant. Slightly more ranked technology design (16.1%) and operation & control (17.5%) as unimportant.
Turnover
|
An estimated 81.8% of newly hired employees in health care & social assistance still worked for the same employer after one quarter (see Table 6). This is higher than the percentage of all newly hired employees across all industries still working for the same employer after one quarter (75.8%; see Table 5 at http://doe.state.wy.us/LMI/energy/New_Hires_Turnover_4Q.htm). A slightly lower proportion of nursing assistants (75.2%) were working for the same employer one quarter later. The percentage of employees still working for the same employer after one quarter ranged from 16.7% (data entry keyers) to 100.0% (e.g., cooks, institution & cafeteria; and physical therapist aides).
Demographics
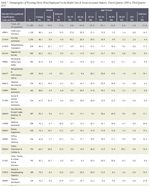 |
Nearly three-fourths (72.8%) of newly hired workers in the health care & social assistance industry were female and 15.5% were male (see Table 7). The highest percentage of individuals was in the 25-34 age group (25.9%). Note that gender was unknown for 11.6% and age was unknown for 11.8%. In these cases, individuals’ demographic data were not available from Wyoming Department of Workforce Services administrative databases (e.g., Unemployment Insurance, Workers’ Compensation), or the individuals did not possess a Wyoming driver’s license and most likely were from out of state (Jones, 2004). The distribution of health care & social assistance new hires by gender and age group in Wyoming is consistent with the distribution for all workers in this industry in 2010. Females constituted 74.3% of all workers in health care & social assistance, while 17.2% were male. Those age 25-34 made up the largest percentage by age group at 21.6% (Wyoming Department of Workforce Services, Research & Planning, n.d.). Among newly hired nursing assistants in this industry, an even greater percentage (86.1%) were female. By age group, slightly more than half (51.0%) were ages 20-34, with the remainder distributed among the other age groups.
Involvement in Energy-Efficient Activities
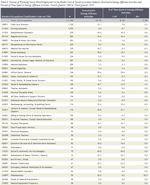 |
Table 8 shows newly hired Wyoming workers’ involvement with energy-efficient activities and the percentage of time they spent on these activities. An estimated 10.7% of all newly hired health care & social assistance industry workers were involved in energy-efficient activities. Less than one-tenth (8.1%) of all workers spent less than half of their time engaged in these activities, while 2.6% spent half their time or more engaged in energy-efficient activities. The percentage of all nursing assistants engaged in energy-efficient activities was 4.4%, with 0.7% of individuals in this occupation spending less than half of their time in these activities, and 3.6% spending half of their time or more engaged in these activities.
Health care & social assistance firms may seem unlikely candidates for implementing energy-efficient activities, but the fact that they consume significant quantities of energy makes them ideal for taking action towards improved energy efficiency. According to the U.S. Environmental Protection Agency (EPA; n.d.), health care & social assistance organizations spend more than $6.5 billion per year on energy, and the amount is rising to meet patients’ needs. In addition,
“Hospitals protect their bottom line by being more energy efficient – every $1 a non-profit healthcare organization saves on energy is equivalent to generating $20 in new revenues for hospitals or $10 for medical offices. For-profit hospitals, medical offices, and nursing homes can raise their earnings per share a penny by reducing energy costs just 5 percent. By being more energy efficient and saving money, hospitals can reinvest savings from improved energy performance” (U.S. Environmental Protection Agency, n.d.).
 |
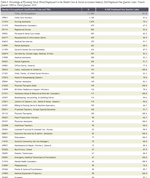
Additionally, a study conducted by Johnson Controls in conjunction with the American Society for Healthcare Engineering and the International Facility Management Association found that nearly two-thirds of health care & social assistance organizations (62%) said they plan to make investments in energy efficiency in 2011 (Environmental Leader, 2010). Table 9 shows that in eight health care occupations, 100% of the newly hired employees were involved in energy-efficient activities (shipping, receiving, & traffic clerks; all other construction & related workers; insulation workers, floor, ceiling, & wall; human resources specialists; carpenters; first-line supervisors/managers of retail sales workers; and farmworkers, farm & ranch animals). Of those eight, three had 100% of employees who worked half their time or more in energy-efficient activities (all other construction & related workers; insulation workers, floor, ceiling, & wall; and carpenters).
Summary
The data shown in the tables give prospective workers an idea of what they can expect for a given occupation, including wages, benefits, skills requirements, and other information. It can also help inform training providers about the skills with which they need to equip students. Research & Planning is continuing to collect survey data about new hires.
Senior Economist Sara Saulcy can be reached at (307) 473-3819 or sara.saulcy@wyo.gov.
References
Environmental Leader. (2010, July 13). Two-Thirds of Healthcare Orgs Planning Efficiency Investments. Retrieved February 7, 2012, from http://www.environmentalleader.com/2010/07/13/two-thirds-of-healthcare
-orgs-planning-efficiency-investments/?graph=full&id=1
Harmon, C., Oosterbeek, H., & Walker, I. (2003, April). The returns to education: microeconomics. Journal of Economic Surveys 17(2). Accessed February 22, 2012, from http://proxy.lib.wy.us/login?url=http://search.ebscohost.com/login.aspx?
direct=true&db=buh&AN=9387056&site=ehost-live&scope=site
Jones, S. (2004). Worker residency determination — Wyoming stepwise procedure. Wyoming Labor Force Trends, 41(8). Accessed May 3, 2011, from http://doe.state.wy.us/LMI/0804/a1supp.htm
Topel, R. (1991, February). Specific Capital, Mobility, and Wages: Wages Rise With Job Seniority. Journal of Political Economy. Accessed February 8, 2012, from http://www.stanford.edu/~pista/topel.pdf
U.S. Environmental Protection Agency. (n.d.). Healthcare: An Overview of Energy Use and Energy Efficiency Opportunities. Accessed February 7, 2012, from http://www.energystar.gov/ia/business/challenge/learn_more/
Healthcare.pdf?8020-1e0b
Weiss, A. (1995, Fall). Human Capital vs. Signalling Explanations of Wages. Journal of Economic Perspectives 9(4). Accessed February 8, 2012, from http://proxy.lib.wy.us/login?url=http://search.ebscohost.com/login.aspx?
direct=true&db=buh&AN=9512181464&site=ehost-live&scope=site
Wyoming Department of Workforce Services, Research & Planning. (n.d.). Average Earnings by Age and Gender in the Health Care & Social Assistance (62) Industry in 2010. Accessed February 10, 2012, from http://doe.state.wy.us/LMI/earnings_tables/2011/WR_Demographics2010/
Industry/demographics_by_industry280.html
1The median is the numerical value separating the higher half of a sample from the lower half. This value is found by arranging all of the values from lowest to highest and selecting the middle value. In the event that there are an even number of observations, the median is defined as the mean or average of the two middle values.