
Local Jobs and Payroll in Wyoming: Construction Sector Sheds Jobs in Second Quarter 2011; Mining Shows Gains
Wyoming’s construction sector continued to shed large numbers of jobs in second quarter 2011, marking 11 consecutive quarters of decline. The largest job gains again occurred in mining (including oil & gas).
Related Tables and Figures
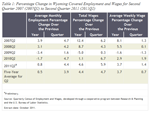 |
Total unemployment insurance (UI) covered payroll in Wyoming increased by $129.7 million (4.6%) in second quarter 2011. Employment rose by 2,227 jobs (0.8%) and average weekly wage increased by $29 (3.7%). These increases are very similar to their five-year averages (see Table 1). The mining sector (including oil & gas) added the largest number of new jobs, while construction employment continued to fall. UI covered payroll represents approximately 91% of all wage and salary disbursements and 43% of personal income in the state (U.S. Bureau of Economic Analysis, 2011). Analysts have noted that “minerals related employment is one of the key predictors of sales and use tax income” in the state (CREG, 2010).
The covered payroll and employment data in this article are tabulated by place of work, in contrast to the labor force estimates, which are a measure of employed and unemployed persons by place of residence. Also, the employment data presented in this article represent a count of jobs, not persons. When individuals work more than one job, each is counted separately. Finally, job growth (or decline) is stated in terms of net change. The Quarterly Turnover Statistics by Industry table presents alternative measures of job gains and losses using the same data sources and calculated to describe the components of change.
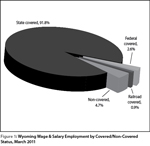 |
Figure 1 shows Wyoming wage & salary employment by covered/non-covered status. Approximately 92% of wage & salary jobs in the state are covered by state unemployment insurance, while 2.6% of jobs are covered by federal unemployment insurance, and 1% are covered by unemployment insurance administered by the railroad retirement board. There are several categories of non-covered jobs, and together they account for nearly 5% of wage & salary jobs in the state. Some examples of non-covered employment include elected officials, students working at educational institutions, employees of churches, and workers at small non-profit organizations.
The purpose of this article is to illustrate and describe employment and payroll changes between second quarter 2010 and second quarter 2011. These economic changes help gauge the overall strength of Wyoming’s economy and identify the fastest and slowest growing sectors and geographic areas.
 |
 |
 |
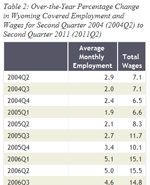
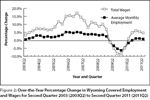
Total payroll growth has been fairly stable for the past four quarters, ranging from 4.6% to 6.0% (see Table 2). This is approximately one-third to one-half of the level seen during much of 2006-2008.
Employment growth has also been modest in recent quarters (see Figure 2). Second quarter’s job growth rate of 0.8% was marginally slower than in the two previous quarters.
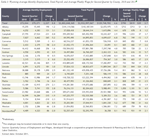
Employment increased in 13 counties, decreased in 9 counties, and was unchanged in one county (see Table 3). Total payroll increased in all but three counties.
In Sweetwater County employment grew by 686 jobs (2.9%) and total payroll increased by $25.9 million (8.4%). Mining (including oil & gas) posted the largest job gains (approximately 500 jobs), followed by administrative & waste services (more than 150 jobs), transportation & warehousing (more than 100 jobs), and local government (including public schools, colleges, & hospitals; approximately 100 jobs). Employment fell in construction (more than 150 jobs) and other services (nearly 200 jobs).
Fremont County added 256 jobs (1.6%) and its total payroll rose by $7.3 million (4.8%). Job gains were seen in mining (nearly 150 jobs), construction (more than 100 jobs), agriculture (more than 50 jobs), and professional & technical services (more than 50 jobs). Employment fell in federal government, local government, and retail trade.
Park County gained 240 jobs (1.7%) and its total payroll increased by $4.5 million (3.8%). Accommodation & food services added more than 100 jobs and smaller job gains were seen in mining, construction, and wholesale trade. Job losses occurred in federal government and retail trade.
Carbon County lost 365 jobs (-5.2%) and its total payroll decreased by $4.7 million (-6.8%). Employment fell by approximately 400 jobs in construction. Smaller job losses were seen in retail trade and health care & social assistance. Employment grew slowly in transportation & warehousing, professional & technical services, administrative & waste services, accommodation & food services, and local government.
Teton County’s employment fell by 315 jobs (-1.9%), but its total payroll rose by $5.3 million (3.6%). Employment decreased in construction (approximately 100 jobs), accommodation & food services (approximately 100 jobs), and federal government (more than 50 jobs).
Sheridan County lost 274 jobs (-2.1%) and its total payroll fell by $200,000 (-0.2%). Construction employment fell by more than 150 jobs, accommodation & food services fell by more than 50 jobs, retail trade fell by approximately 50 jobs, and professional & technical services fell by approximately 50 jobs. Employment increased slightly in health care & social assistance.
Campbell County’s employment fell by 231 jobs (-0.8%), but its total payroll rose by $10.2 million (2.9%). Job losses in construction (nearly 1,000 jobs) more than offset gains in mining (including oil & gas; more than 350 jobs), other services (more than 100 jobs), and administrative & waste services (approximately 100 jobs).
Natrona County added 1,090 jobs (2.9%) and its total payroll rose by $37.7 million (9.4%). Mining (including oil & gas) grew by 726 jobs (24.4%). Large job gains were seen in other services (222 jobs, or 13.3%), wholesale trade (172 jobs, or 7.5%), and manufacturing (161 jobs, or 10.3%). Job losses occurred in retail trade (-194 jobs, or -4.0%), federal government (-157 jobs, or -18.4%), and construction (-64 jobs, or -2.4%).
Employment in Laramie County grew by 825 jobs (1.9%). Transportation & warehousing added 226 jobs (10.7%), accommodation & food services added 189 jobs (4.8%), and health care & social assistance added 159 jobs (4.2%). Mining (including oil & gas) grew by 74 jobs (145.1%). Federal government employment declined because of the completion of the decennial census.
 |
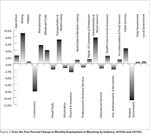 |
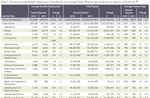
When viewed from an industry perspective, the largest job gains occurred in mining (including oil & gas), transportation & warehousing, administrative & waste services, manufacturing, and other services (see Table 4 and Figure 3). Sizeable job losses were seen in construction, federal government, retail trade, and finance & insurance.
Mining employment continued to grow at a rapid pace, gaining 2,217 jobs (9.0%). Its total payroll increased by $62.8 million (14.0%). Mining, except oil & gas added approximately 250 jobs and support activities for mining added approximately 1,900 jobs.
Transportation & warehousing added 614 jobs (7.1%) and its total payroll rose by $11.8 million (12.7%). Truck transportation grew by nearly 500 jobs and warehousing & storage grew by more than 100 jobs. Growth in trucking employment may be related to recent increases in oil & gas activity in the state.
Administrative & waste services gained 569 jobs (7.7%) and its total payroll increased by $7.6 million (15.3%). The largest employment increases were seen in temporary help services (nearly 450 jobs) and waste management & remediation services (approximately 100 jobs).
Employment in health care & social assistance increased by 523 jobs (2.3%) and its total payroll rose by $15.2 million (7.0%). Ambulatory health care services added 280 jobs (3.2%) and social assistance added 151 jobs (2.3%).
Manufacturing added 470 jobs (5.5%) and its total payroll increased by $11.9 million (11.0%). The largest job gains occurred in fabricated metal product manufacturing (approximately 200 jobs), chemical manufacturing (approximately 100 jobs), and transportation equipment manufacturing (approximately 50 jobs). Employment also increased in wood product manufacturing, printing & related support activities, plastics & rubber products manufacturing, machinery manufacturing, and electrical equipment & appliance manufacturing.
Construction lost 1,855 jobs (-8.2%) and its total payroll fell by $23.7 million (-9.2%). Construction of buildings lost nearly 200 jobs, heavy & civil engineering construction lost approximately 1,250 jobs, and specialty trade contractors lost more than 400 jobs. Sizable job losses occurred in oil & gas pipeline & related structures construction (nearly 800 jobs).
Federal government employment fell by 945 jobs (-10.8%) and its total payroll decreased by $1.5 million (-1.3%). Practically all of this decrease in jobs was related to the completion of the decennial census.
Employment in retail trade decreased by 509 jobs (-1.7%) and its total payroll fell by $1.7 million (-0.9%). The largest job losses occurred in nonstore retailers (including catalog & Internet retailers; more than 200 jobs), food & beverage stores (nearly 200 jobs), and miscellaneous store retailers (nearly 100 jobs). Job gains were seen in motor vehicle & parts dealers (approximately 100 jobs) and general merchandise stores (including warehouse clubs & supercenters; approximately 100 jobs).
Finance & insurance lost 170 jobs (-2.5%), but its total payroll increased very slightly ($0.6 million, or 0.8%). Employment decreases were seen in credit intermediation & related activities (more than 100 jobs) and insurance carriers & related activities (approximately 50 jobs).
In summary, growth in employment and wages was similar to recent quarters, with strong job gains in mining (including oil & gas) being partially offset by large job losses in construction.
Consensus Revenue Estimating Group (CREG) (2010, October). Wyoming state government revenue forecast fiscal year 2011-fiscal year 2016. Retrieved February 17, 2011, from http://eadiv.state.wy.us/creg/GreenCREG_Oct10.pdf
U.S. Bureau of Economic Analysis. (2011, March 16). SA04 State income and employment summary — Wyoming. Retrieved March 16, 2011, from http://www.bea.gov/regional/spi/default.cfm