Postsecondary Opportunities in Wyoming and 11 Other States: Community Colleges
PDF Table 2 (PDF) Table 2 (Excel) Appendix 1 Map of Wyoming University of Wyoming
Research & Planning (R&P) is a separate exclusively statistical entity within the Wyoming Department of Workforce Services. R&P collects, analyzes, and publishes timely and accurate labor market information. Through memoranda of understanding with the Wyoming Department of Education, the University of Wyoming, the Wyoming Community College Commission, other Wyoming state agencies, 11 partner states, and others, R&P has the ability to examine postsecondary and workforce employment and wage outcomes by linking student graduation records with other administrative databases.
This type of research helps inform students, jobseekers, educators, training providers, and others of employment and wage trends for specific areas of study. Table 2 provides information on Wyoming community college graduates from the 2011/12, 2012/13, and 2013/14 school years combined. Readers can use the data in Table 2 to gain an understanding of employment opportunities for different fields of study.
A map showing the locations of Wyoming's community colleges is available at http://doe.state.wy.us/LMI/education_we_connect/map_WY_colleges_cities.pdf.
A similar article on University of Wyoming graduates (http://doe.state.wy.us/lmi/education_we_connect/UW_Table.htm) includes methodology used in this research, background information, and a review of related literature.
Discussion
Table 2 provides information on Wyoming community college graduates from the 2011/12, 2012/13, and 2013/14 school years combined. By linking Wyoming community college files with wage records, R&P is able to track these graduates’ employment and wages in Wyoming and R&P’s 11 partner states (Alaska, Colorado, Idaho, Montana, Nebraska, New Mexico, Ohio, Oklahoma, South Dakota, Texas, and Utah).
Table 2 shows employment and wage data for each Classification of Instructional Programs (CIP) code for the calendar year and quarter of graduation and the first four quarters after graduation. Table 2 shows that 8,609 total individuals graduated with 10,878 total academic and occupational degrees from Wyoming’s seven community colleges. Graduation year includes the summer, fall, and spring semesters of two consecutive calendar years. For instance, 2011/12 would include the summer 2011, fall 2011, and spring 2012 graduates. Total individuals refers to the number of distinct individual social security numbers (SSNs) graduating in a given year, while total degrees includes distinct college, student ID, degree date, degree, and six-digit CIP codes combinations. In other words, one individual may have graduated with multiple degrees in the same year. Median quarterly wages presented in Table 2 are presented in terms of nominal dollars. Percent degrees is calculated by the number of degrees found in wage records each quarter divided by the total number of degrees. See Appendix 1 for a complete listing of table definitions.
|
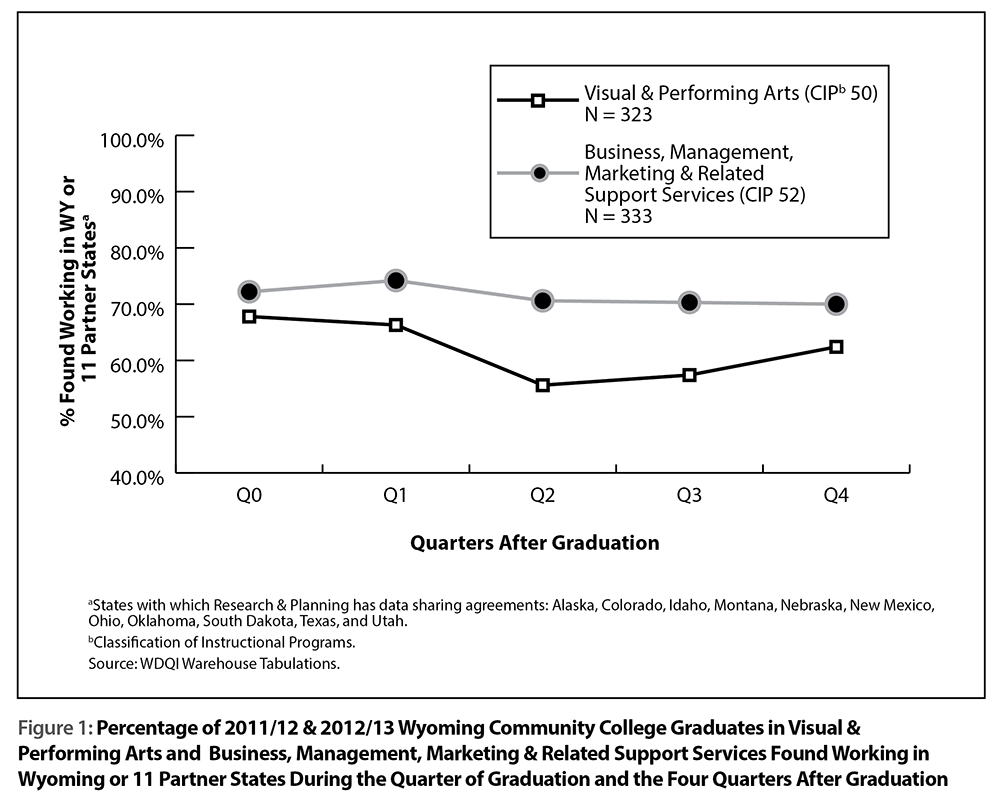
Table 2 shows that 333 total individuals from Wyoming’s seven community colleges graduated from an academic program with CIP Code 52 (Business, Management, Marketing, and Related Support Services) and 323 total individuals graduated from an academic program with CIP Code 50 (Visual and Performing Arts). Figure 1 was created using data from Table 2, and shows the percentage of graduates from select two-digit CIP codes found working in Wyoming or 11 partner states during each of the four quarters after graduation. As shown in Figure 1, a greater percentage of the 333 business, management, marketing, and related support services graduates were found working in Wyoming or partner states during the four quarters after graduation compared to the percentage of the 323 visual and performing arts graduates. Individuals who graduated with a degree in business, management, marketing, and related support services had more success finding a job in Wyoming or partner states than those who graduated with a degree in visual and performing arts.
|
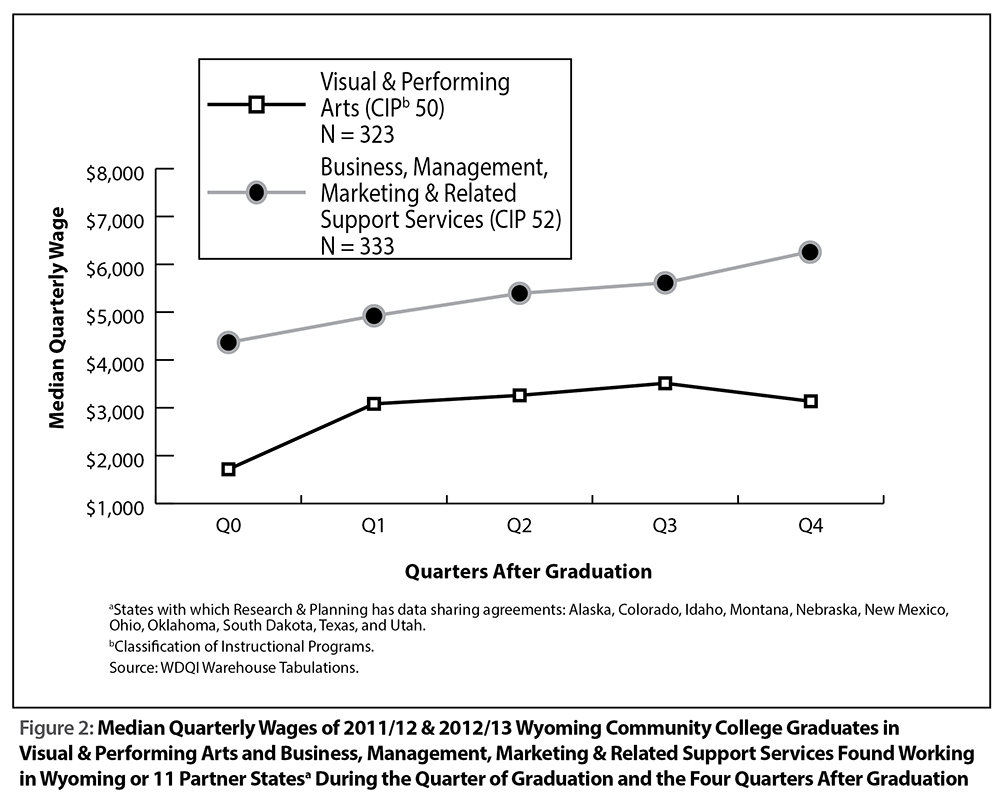
Table 2 can also be used to compare wages between different CIP codes. Figure 2 was built with median quarterly wage data from Table 2, and compares the median quarterly wages of visual and performing arts graduates and business, management, marketing, and related support services graduates. Figure 2 shows that the median quarterly wage for business, management, marketing and related support services graduates was higher than the median quarterly wage for visual and performing arts graduates during each of the four quarters following graduation.
Summary and Future Research
The data presented in Table 2 and illustrated in the examples in Figures 1 and 2 can be very valuable to educators, policymakers, training providers, students, jobseekers, and other stakeholders in Wyoming. Educators, policymakers, and training providers can use this information to determine their return on investment; in other words, which fields of study are more likely to produce educated workers who will be retained in Wyoming? Students and jobseekers can use this information to plan for their education and careers by understanding the likelihood that they will be able to find work in Wyoming for a given degree, and which fields of study may result in higher paying jobs.
By familiarizing themselves with data presented in these tables, readers can help determine the particular fields of study that consistently produce solid wages. These tables can also give some indication as to how likely jobseekers are to find a job in a particular field of study in this region.
Future studies using these data will be able to show which programs are most likely to produce graduates who maintain ties to Wyoming’s economy, which may help lawmakers and stake holders make informed decisions when supporting academic programs. Overall, Wyoming is far ahead of many other states in using high quality data to assess labor market outcomes.
For more information on CIP codes, please see http://doe.state.wy.us/lmi/education_we_connect/UW_Table.htm.
Funding of this Research
This workforce product was funded by a grant awarded by the U.S. Department of Labor’s Employment and Training Administration. The product was created by the grantee and does not necessarily reflect the official position of the U.S. Department of Labor. The U.S. Department of Labor makes no guarantee, warranties, or assurances of any kind,express or implied, with respect to such information, including any information on linked sites and including, but not limited to, accuracy of the information or its completeness, timeliness, usefulness, adequacy, continued availability, or ownership. This product is copyrighted by the institution that created it. Internal use by an organization and/or personal use by an individual for non-commercial purposes is permissible. All other uses require the prior authorization of the copyright owner.