Postsecondary Opportunities in Wyoming and 11 Other States: University of Wyoming
PDF Table 1 (PDF) Table 1 (Excel) Appendix 1 Community Colleges
Research & Planning (R&P) is a separate exclusively statistical entity within the Wyoming Department of Workforce Services. R&P collects, analyzes, and publishes timely and accurate labor market information. Through memoranda of understanding with the Wyoming Department of Education, the University of Wyoming, the Wyoming Community College Commission, other Wyoming state agencies, 11 partner states, and others, R&P has the ability to examine postsecondary and workforce employment and wage outcomes by linking student graduation records with other administrative databases.
As noted by Faler (2016): “the extensive data to which R&P has access allows for high quality causational studies. … Evaluating the effectiveness of employment and training initiatives serves both policy makers and program customers. Outcome reports can provide the information policy makers need to better direct government resources of time and money. Knowing a program’s outcomes can also allow customers to make informed decisions about participation and realistic assumptions about their results.”
|
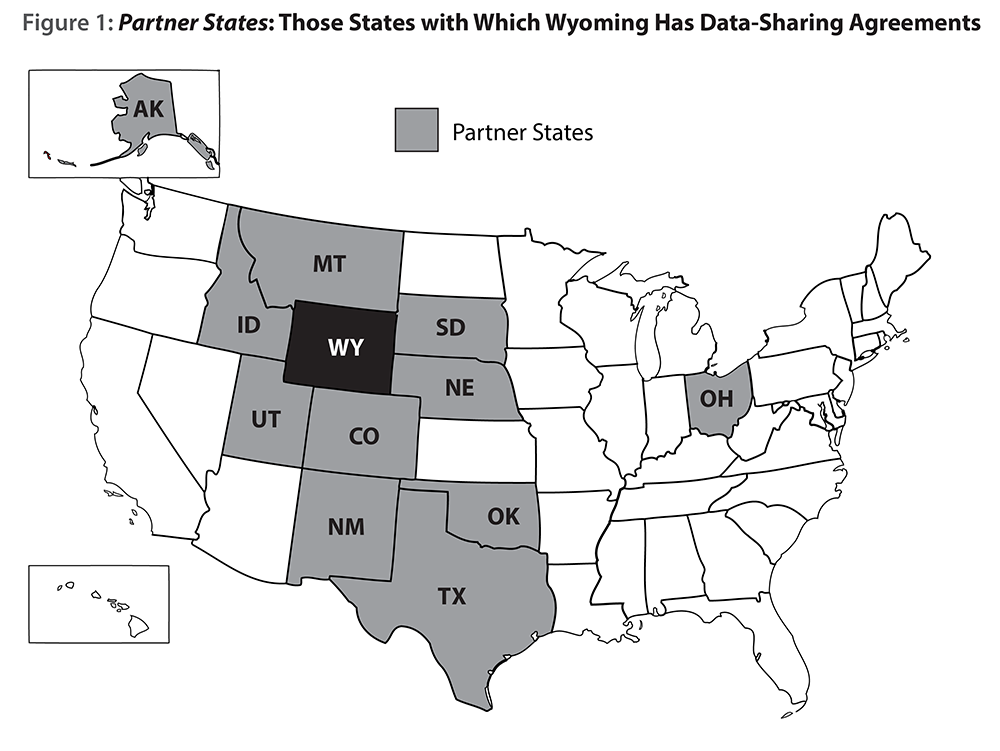
The purpose of this article is to illustrate R&P’s ability to track University of Wyoming (UW) graduates into the labor market by linking UW data files with administrative databases for Wyoming and 11 partner states. As shown in Figure 1, Wyoming has data sharing agreements with Alaska, Colorado, Idaho, Montana, Nebraska, New Mexico, Ohio, Oklahoma, South Dakota, Texas, and Utah. These states represent much of the region that surrounds Wyoming, and other states that have similar economies with a strong presence of oil & gas. This type of research helps inform students, jobseekers, educators, training providers, and others of employment and wage trends for specific areas of study.
A similar article discussing outcomes for Wyoming community college graduates is availble at http://doe.state.wy.us/LMI/education_we_connect/WCCC_Table.htm.
Discussion
In Leveraging Employment Data to Measure Labor Market Outcomes (2016), Zinn states, “The nation’s students, educators, and policymakers are increasingly calling for better information to demonstrate that postsecondary education provides people with opportunities … information about postcollege labor market outcomes is critical to help students make wiser choices about their education and careers, post secondary institutions ensure and demonstrate that their offerings are effectively preparing students to succeed in the job market.” Providing this information to individuals who are entering postsecondary education for the first time, returning for training, or starting a new career is crucial in establishing a foundation for success in whatever field of study they may pursue.
Zinn (2016) also notes “the growing consensus that postcollege labor market outcomes are one critical component of information that should be available to students, institutions, and other stakeholders.” This is illustrated in Table 1, which R&P created by linking UW files with wage records for Wyoming and the 11 partner states with which R&P has data sharing agreements. Wage records represent an individual’s wage history based on employers’ quarterly wage and employment reports to the Unemployment Insurance (UI) tax section of the Wyoming Department of Workforce Services and the UI tax entities of selected other states (Bullard, 2015).

|
Each graduate’s field of study is defined by the Classification of Instructional Programs (CIP) code system, which is maintained by the National Center for Education Statistics (NCES) categorized by two-, four-, and six-digit levels of instructional programs. The CIP code structure is illustrated in Figure 2. The purpose of the classification system is to support the accurate tracking, assessment, and reporting of fields of study and program completions activity. A complete listing of CIP codes can be found at https://nces.ed.gov/pubs2002/cip2000/.
Table 1 provides information on UW graduates from the 2007/08 school year to 2013/14. By linking UW files with wage records, R&P is able to track these graduates’ employment and wages in Wyoming and R&P’s 11 partner states. Table 1 shows employment and wage data for each CIP code for the calendar year and quarter of graduation and the first four quarters after graduation.
For example, Table 1 shows that in 2007/08, 2,409 total individuals graduated with 2,470 total degrees. Graduation year includes the summer, fall, and spring semesters of two consecutive calendar years. For example, 2007/2008 would include the summer 2007, fall 2007, and spring 2008 graduates. Total individuals refers to the number of distinct individual social security numbers (SSNs) graduating in a given year, while total degrees includes distinct college, student ID, degree date, degree, and six-digit CIP codes combinations. In other words, one individual may have graduated with multiple degrees in the same year. Median quarterly wages presented in Table 1 are presented in terms of nominal dollars. See Appendix 1 for a complete listing of table definitions.
Comparing Fields of Study

|
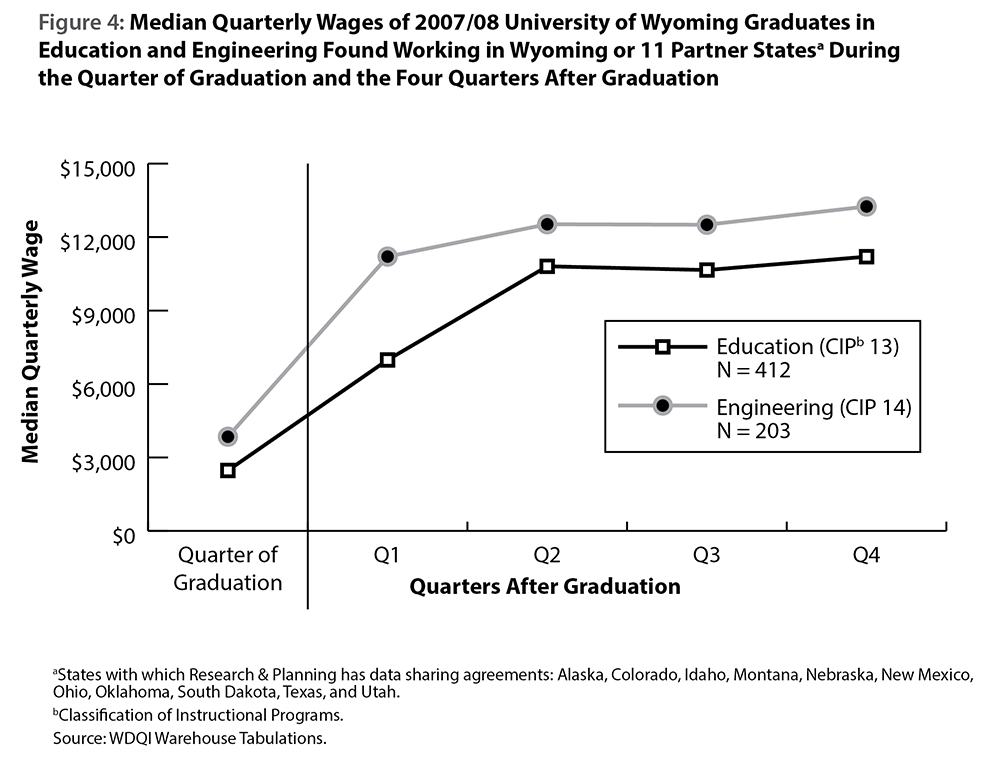
Readers can use the data in Table 1 to gain an understanding of employment opportunities for different fields of study. For example, in 2007/08, there were 412 total individual who graduated from a program with CIP Code 13 (Education) and 203 total individuals who graduated from a program with CIP Code 14 (Engineering). Figure 3 was created using data from Table 1, and shows the percentage of graduates from each CIP code found working in Wyoming or 11 partner states during each of the four quarters after graduation. As shown in Figure 3, a greater percentage of the 412 education graduates for 2007/08 were found working in Wyoming or partner states during the four quarters after graduation compared to the percentage of the 203 engineering graduates. Individuals who graduated with a degree in education had more success finding a job in Wyoming or partner states than those who graduated with a degree in engineering.
|
Table 1 can also be used to compare wages between different CIP codes. For example, Figure 4 was built with median quarterly wage data from Table 1, and compares the median quarterly wages of education graduates and engineering graduates. Figure 4 shows that the median quarterly wage for engineering graduates was higher than the median quarterly wage for education graduates during each of the four quarters following graduation.
The data presented in Table 1 and illustrated in the examples in Figures 2 and 3 can be very valuable to educators, policymakers, training providers, students, jobseekers, and other stakeholders in Wyoming. Educators, policymakers, and training providers can use this information to determine their return on investment; in other words, which fields of study are more likely to produce educated workers who will be retained in Wyoming? Students and jobseekers can use this information to plan for their education and careers by understanding the likelihood that they will be able to find work in Wyoming for a given degree, and which fields of study may result in higher paying jobs.
Comparing Wages Over Time
The data in Table 1 can also be used to determine if wages have remained constant or changed over time for graduates from the same CIP code. For example, Business, Management, & Marketing graduates (CIP Code 52) from 2007/08 had a median quarterly wage of $9,368 four quarters after graduation. By comparison, graduates from this same CIP code in 2013/14 had a median quarterly wage of $10,154 four quarters after graduation. This indicates that nominal (unadjusted) wages four quarters after graduation increased from 2007/08 to 2013/14.
Conclusion and Future Research
By familiarizing themselves with data presented in these tables, readers can help determine the particular fields of study that consistently produce solid wages. These tables can also give some indication as to how likely jobseekers are to find a job in a particular field of study in this region.
Future studies using these data will be able to show which programs are most likely to produce graduates who maintain ties to Wyoming’s economy, which may help lawmakers and stake holders make informed decisions when supporting academic programs. Overall, Wyoming is far ahead of many other states in using high quality data to assess labor market outcomes.
References
Faler, K. (2016). Review of the literature. Wyoming’s Hathaway Scholarship Program: A Workforce Outcomes Evaluation of a State Merit-Based Scholarship Initiative Using Administrative Records. In press.
Zinn, R. (May 2016). Classroom to Career: Leveraging Employment Data to Measure Labor Market Outcomes.
Bullard, D. (2015). Local jobs and payroll in Wyoming in first quarter 2015: job losses appear in the oil & gas sector. Wyoming Labor Force Trends, 52(10). Retrieved June 6, 2016, from http://doe.state.wy.us/LMI/trends/1015/1015.pdf
Funding of this Research
This workforce product was funded by a grant awarded by the U.S. Department of Labor’s Employment and Training Administration. The product was created by the grantee and does not necessarily reflect the official position of the U.S. Department of Labor. The U.S. Department of Labor makes no guarantee, warranties, or assurances of any kind,express or implied, with respect to such information, including any information on linked sites and including, but not limited to, accuracy of the information or its completeness, timeliness, usefulness, adequacy, continued availability, or ownership. This product is copyrighted by the institution that created it. Internal use by an organization and/or personal use by an individual for non-commercial purposes is permissible. All other uses require the prior authorization of the copyright owner.