Alternative Measures of Labor Underutilization
by: Carola Cowan, BLS Programs Supervisor
Seasonally Adjusted Data
Seasonally adjusted data take out seasonal fluctuations in a data series. This makes data comparable across states and transforms them into an economic indicator. If data are not seasonally adjusted, we see more ups and downs due to things such as weather or tourist seasons. For example, as the winter starts, we see a decrease in employment in construction. In northern states you may see this trend earlier than in southern states. If data are not seasonally adjusted, we don’t know whether an increase in unemployment is due to the seasonal factor or the economy. If the data are seasonally adjusted we can attribute changes in the unemployment rate to the economy.
The state’s unemployment rate is a key economic indicator on how well the labor market in Wyoming is performing. Wyoming’s unemployment rate has been estimated to have increased from 3.3% in July 2008 to 6.5% in July 2009, but is still well below the national average of 9.4% (seasonally adjusted). In the past few months, the media have mentioned alternative measures of unemployment. These numbers previously have only been available on a national level. In March, the Bureau of Labor Statistics (BLS) released the same numbers as annual averages for 2007 and 2008 for states.
Alternative measures of unemployment have been developed to look at the labor market from different perspectives. Not all possible labor market difficulties can be assessed with just one number. Therefore, six different measures of labor underutilization have long been published monthly from the Current Population Survey (CPS) for the nation. The six measures are referred to as U-1 to U-6. The number we see in the news as the official unemployment rate for the nation is U-3. The official number for Wyoming is modeled by the Local Area Unemployment Statistics program using numbers from CPS, UI claims data, and the Current Employment Statistics because the CPS sample on the state level is too small to make a reliable estimate. It is therefore not the same as U-3, which comes from the CPS, but both use the same definition regarding who is included or not included in the count. Two of the other measures (U-1 and U-2) are, by definition, more restrictive than the U-3 rate. The other three measures (U-4, U-5, and U-6) are defined more broadly than U-3, and include individuals not included in U-3. All six measures are calculated using data collected by the CPS.
The six measures of labor underutilization are defined by the BLS (U.S. Department of Labor):
- U-1 – people unemployed 15 weeks or longer, as a percentage of the civilian labor force;
- U-2 – job losers and people who completed temporary jobs, as a percentage of the civilian labor force;
- U-3 – total unemployed, as a percentage of the civilian labor force (the official unemployment rate for the nation);
- U-4 – total unemployed, plus discouraged workers, as a percentage of the civilian labor force plus discouraged workers;
- U-5 – total unemployed, plus discouraged workers, plus all other marginally attached workers, as a percentage of the civilian labor force plus all marginally attached workers;
- U-6 – total unemployed, plus all marginally attached workers, plus total employed part-time for economic reasons, as a percentage of the civilian labor force plus all marginally attached workers.
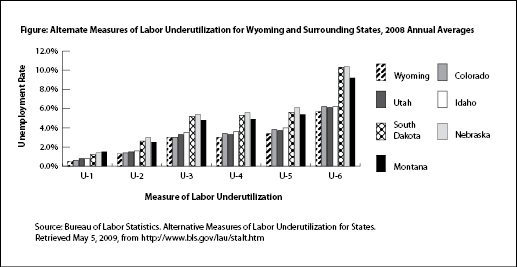
As can be seen in Tables
1 and 2, U-1 has the lowest unemployment rate because it is the most restrictive by counting only the long-term unemployed (at least 15 weeks). If this number increases we know people have a harder time finding new employment after losing their job. In Wyoming, the number of people affected was approximately 1,450 for 2007 and 2008.
The second lowest is U-2. It only counts people who lost their jobs but not people who voluntarily quit or who entered the labor market for the first time or reentered the labor market. An increase in U-2 suggests that more people are unemployed because they got laid off, as opposed to those who left their job voluntarily. This translates into approximately 3,450 and 3,800 unemployed in Wyoming in 2007 and 2008, respectively.
U-3 is the official unemployment rate for the nation and the rate reported most widely in the news. It includes all jobless people who are available to work and have actively looked for work in the past four weeks. This fits the basic definition of unemployed because people have to actively look for work to be counted as unemployed. In Wyoming in 2007, there were an estimated 8,346 unemployed people on an annual average basis; in 2008 there were 9,008. This number, as well as U-1 and U-2, has been produced since 1948 and therefore is useful in making long-term historical comparisons.
U-4 and U-5 include persons who are not considered to
be in the civilian labor force. People not in the labor force are ordinarily
not considered employed or unemployed. These two rates, as well as U-6,
were first reported nationally in 1994. U-4 includes discouraged workers,
who want a job but have given up searching because they believe they
will not be able to find one. The number of discouraged workers is relatively
small, and U-4 is very close to the U-3 rate. In 2008, the rate for U-3
and U-4 was the same in Wyoming (see Table 2). The approximate numbers were 8,650 and 8,700 for 2007 and 2008, respectively. If U-1 rises, we may find U-4 increasing, because the longer it takes people to find a new job, the more likely they are to become discouraged in their job search.
U-5 includes all marginally attached workers, defined as the number of discouraged workers plus the number of workers who, for a variety of reasons, did not look for a job in the last month but have looked for one in the past year. This estimate is around 10,000 in Wyoming. An increase here will mostly likely be tied to long-term unemployment and therefore an increase in U-1.
The broadest measure of the unemployment rate is U-6. This number includes the unemployed, all marginally attached workers, and the underemployed. Underemployed workers have a job, and therefore would ordinarily not be counted as unemployed, but work fewer hours than they would prefer. In Wyoming, this translates to about 16,650 people. A faster increase in U-6 than U-3 suggests that employers are not laying off people, but instead are reducing the hours worked to adjust for economic conditions.
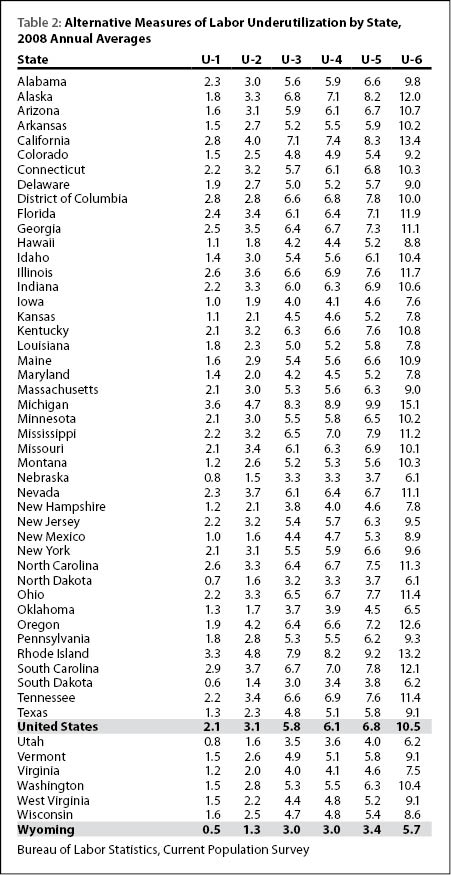
These six measures differ in magnitude from each other but usually move in the same direction over time. Table 2 shows that Michigan had the highest rates for all six measures. Wyoming and South Dakota were tied with the lowest unemployment rate in 2008. Wyoming’s other five measures were the lowest in the nation.
Do these numbers suggest Wyoming had a labor shortage in 2008? The very low U-1 rate of 0.5% suggests that most people in the state don’t have difficulty finding new employment. The U-3 and U-4 rate are tied at 3.0%, suggesting that Wyoming doesn’t have very many people who are discouraged in their job search either. We can therefore conclude that there is not an over-abundance of workers in the state.
Depending on one’s viewpoint, the average unemployment rate in 2008 for Wyoming ranged from 0.5% to 5.7%. For the nation, those numbers are between 2.1% and 10.5%. These alternative measures of labor underutilization can help policy makers address different problems with the labor market such as underemployment.
References
U.S. Department of Labor, U.S. Bureau of Labor Statistics. (Summary 08-06/June 2008). Issues in Labor Statistics, “The Unemployment Rate and Beyond: Alternative Measures of Labor Underutilization.”