
Local Jobs and Payroll in Wyoming: Large Job Gains in Oil & Gas and Related Sectors in Third Quarter 2011
(Tables and Figures)
See related article
Tables 1, 2, 3, 4, 5 (Natrona County), 6 (Laramie County)a
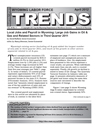
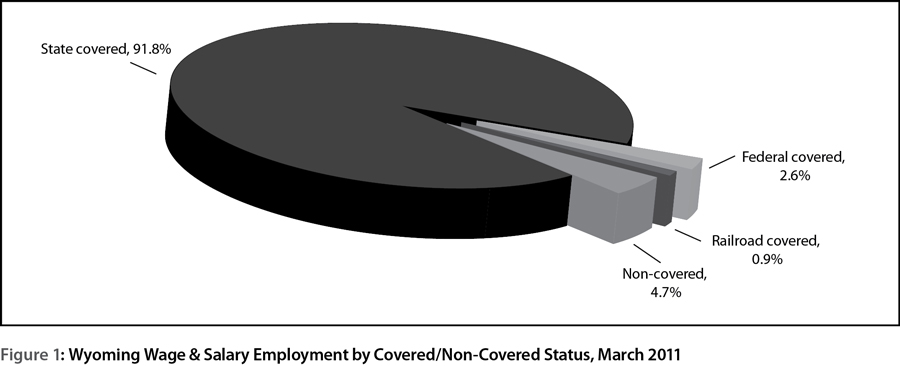
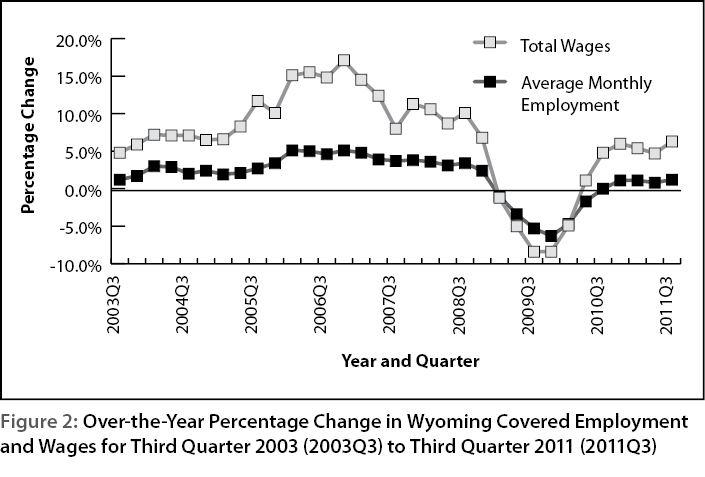
Figures 1, 2, 3
| Average Monthly Employment Percentage Change Over the Previous | Total Wages Percentage Change Over the Previous | Average Weekly Wage Percentage Change Over the Previous | ||||
|---|---|---|---|---|---|---|
| Year | Quarter | Year | Quarter | Year | Quarter | |
| 2007Q3 | 3.7 | 1.8 | 8.0 | 1.0 | 4.1 | -0.8 |
| 2008Q3 | 3.4 | 2.1 | 10.1 | 2.3 | 6.5 | 0.2 |
| 2009Q3 | -5.3 | 0.1 | -8.4 | -1.3 | -3.2 | -1.5 |
| 2010Q3 | 0.0 | 1.9 | 4.8 | 2.3 | 4.8 | 0.3 |
| 2011Q3a | 1.2 | 2.4 | 6.3 | 3.9 | 5.1 | 1.5 |
| Five-Year Average for Q3 | 0.6 | 1.7 | 4.2 | 1.6 | 3.4 | 0.0 |
| aPreliminary. | ||||||
| Source: Quarterly Census of Employment and Wages, developed through a cooperative program between Research & Planning and the U.S. Bureau of Labor Statistics. | ||||||
| Extract date: January 2012. | ||||||
| Average Monthly Employment | Total Wages | |
|---|---|---|
| 2004Q3 | 2.0 | 7.1 |
| 2004Q4 | 2.4 | 6.5 |
| 2005Q1 | 1.9 | 6.6 |
| 2005Q2 | 2.1 | 8.3 |
| 2005Q3 | 2.7 | 11.7 |
| 2005Q4 | 3.4 | 10.1 |
| 2006Q1 | 5.1 | 15.1 |
| 2006Q2 | 5.0 | 15.5 |
| 2006Q3 | 4.6 | 14.8 |
| 2006Q4 | 5.1 | 17.1 |
| 2007Q1 | 4.8 | 14.5 |
| 2007Q2 | 3.9 | 12.4 |
| 2007Q3 | 3.7 | 8.0 |
| 2007Q4 | 3.8 | 11.3 |
| 2008Q1 | 3.6 | 10.6 |
| 2008Q2 | 3.1 | 8.7 |
| 2008Q3 | 3.4 | 10.1 |
| 2008Q4 | 2.4 | 6.8 |
| 2009Q1 | -1.0 | -1.2 |
| 2009Q2 | -3.4 | -5.0 |
| 2009Q3 | -5.3 | -8.4 |
| 2009Q4 | -6.3 | -8.4 |
| 2010Q1 | -4.7 | -4.9 |
| 2010Q2 | -1.7 | 1.1 |
| 2010Q3 | 0.0 | 4.8 |
| 2010Q4 | 1.1 | 6.0 |
| 2011Q1 | 1.1 | 5.4 |
| 2011Q2 | 0.8 | 4.7 |
| 2011Q3a | 1.2 | 6.3 |
| aPreliminary. | ||
| Source: Quarterly Census of Employment and Wages, developed through a cooperative program between Research & Planning and the U.S. Bureau of Labor Statistics. | ||
| Extract date: January 2012. | ||
| Average Monthly Employment | Total Payroll | Average Weekly Wage | ||||||||||
|---|---|---|---|---|---|---|---|---|---|---|---|---|
| County | Third Quarter | Change | Third Quarter | Change | Third Quarter | Change | ||||||
| 2010 | 2011 | n | % | 2010 | 2011 | $ | % | 2010 | 2011 | $ | % | |
| Total | 278,295 | 281,688 | 3,393 | 1.2 | $2,866,694,334 | $3,048,326,192 | $181,631,858 | 6.3 | $792 | $832 | $40 | 5.1 |
| Albany | 15,015 | 15,350 | 335 | 2.2 | $137,111,504 | $143,567,845 | $6,456,341 | 4.7 | $702 | $719 | $17 | 2.4 |
| Big Horn | 4,282 | 4,422 | 140 | 3.3 | 36,192,045 | 38,811,342 | 2,619,297 | 7.2 | 650 | 675 | 25 | 3.8 |
| Campbell | 27,882 | 27,101 | -781 | -2.8 | 375,709,213 | 373,971,940 | -1,737,273 | -0.5 | 1,037 | 1,061 | 24 | 2.3 |
| Carbon | 6,797 | 6,837 | 40 | 0.6 | 61,360,867 | 65,907,594 | 4,546,727 | 7.4 | 694 | 742 | 48 | 6.9 |
| Converse | 5,429 | 5,516 | 87 | 1.6 | 54,730,950 | 59,920,324 | 5,189,374 | 9.5 | 775 | 836 | 61 | 7.9 |
| Crook | 2,383 | 2,348 | -35 | -1.5 | 19,876,382 | 20,737,649 | 861,267 | 4.3 | 642 | 679 | 37 | 5.8 |
| Fremont | 16,784 | 16,762 | -22 | -0.1 | 150,429,446 | 160,531,285 | 10,101,839 | 6.7 | 689 | 737 | 48 | 7.0 |
| Goshen | 4,411 | 4,520 | 109 | 2.5 | 32,769,540 | 35,337,579 | 2,568,039 | 7.8 | 571 | 601 | 30 | 5.3 |
| Hot Springs | 2,177 | 2,184 | 7 | 0.3 | 17,069,771 | 17,940,946 | 871,175 | 5.1 | 603 | 632 | 29 | 4.8 |
| Johnson | 3,398 | 3,388 | -10 | -0.3 | 25,443,151 | 26,954,243 | 1,511,092 | 5.9 | 576 | 612 | 36 | 6.3 |
| Laramie | 42,980 | 43,538 | 558 | 1.3 | 418,565,229 | 455,896,263 | 37,331,034 | 8.9 | 749 | 805 | 56 | 7.5 |
| Lincoln | 6,178 | 6,082 | -96 | -1.6 | 58,502,872 | 63,070,097 | 4,567,225 | 7.8 | 728 | 798 | 70 | 9.6 |
| Natrona | 38,280 | 39,830 | 1,550 | 4.0 | 434,695,410 | 463,451,463 | 28,756,053 | 6.6 | 874 | 895 | 21 | 2.4 |
| Niobrara | 870 | 886 | 16 | 1.8 | 6,162,859 | 6,558,565 | 395,706 | 6.4 | 545 | 569 | 24 | 4.4 |
| Park | 14,976 | 15,319 | 343 | 2.3 | 128,072,177 | 135,384,223 | 7,312,046 | 5.7 | 658 | 680 | 22 | 3.3 |
| Platte | 3,410 | 3,400 | -10 | -0.3 | 29,406,545 | 32,342,409 | 2,935,864 | 10.0 | 663 | 732 | 69 | 10.4 |
| Sheridan | 13,051 | 12,973 | -78 | -0.6 | 115,923,581 | 118,012,622 | 2,089,041 | 1.8 | 683 | 700 | 17 | 2.5 |
| Sublette | 5,875 | 6,289 | 414 | 7.0 | 81,356,507 | 92,366,225 | 11,009,718 | 13.5 | 1,065 | 1,130 | 65 | 6.1 |
| Sweetwater | 23,926 | 24,964 | 1,038 | 4.3 | 292,947,021 | 337,703,392 | 44,756,371 | 15.3 | 942 | 1,041 | 99 | 10.5 |
| Teton | 19,791 | 19,966 | 175 | 0.9 | 180,556,677 | 184,167,641 | 3,610,964 | 2.0 | 702 | 710 | 8 | 1.1 |
| Uinta | 9,688 | 8,951 | -737 | -7.6 | 100,667,849 | 91,623,571 | -9,044,278 | -9.0 | 799 | 787 | -12 | -1.5 |
| Washakie | 4,007 | 3,996 | -11 | -0.3 | 35,594,823 | 37,648,266 | 2,053,443 | 5.8 | 683 | 725 | 42 | 6.1 |
| Weston | 2,273 | 2,254 | -19 | -0.8 | 18,943,143 | 19,192,320 | 249,177 | 1.3 | 641 | 655 | 14 | 2.2 |
| Nonclassifiedb | 4,431 | 4,808 | 377 | 8.5 | 54,606,772 | 67,228,388 | 12,621,616 | 23.1 | 948 | 1,076 | 128 | 13.5 |
| aPreliminary. | ||||||||||||
| bThe employer may be located statewide or in more than one county. | ||||||||||||
| Source: Quarterly Census of Employment and Wages, developed through a cooperative program between Research & Planning and the U.S. Bureau of Labor Statistics. | ||||||||||||
| Extract date: January 2012. | ||||||||||||
| Average Monthly Employment | Total Payroll | Average Weekly Wage | ||||||||||
|---|---|---|---|---|---|---|---|---|---|---|---|---|
| Third Quarter | Change | Third Quarter | Change | Third Quarter | Change | |||||||
| NAICSb Title | 2010 | 2011 | n | % | 2010 | 2011 | $ | % | 2010 | 2011 | $ | % |
| Total, All Industries | 278,295 | 281,688 | 3,393 | 1.2 | $2,866,694,334 | $3,048,326,192 | $181,631,858 | 6.3 | $792 | $832 | $40 | 5.1 |
| Total Private | 215,935 | 219,435 | 3,500 | 1.6 | $2,187,921,201 | $2,348,112,609 | $160,191,408 | 7.3 | $779 | $823 | $44 | 5.6 |
| Agriculture | 2,656 | 2,700 | 44 | 1.7 | 17,563,214 | 18,802,346 | 1,239,132 | 7.1 | 509 | 536 | 27 | 5.3 |
| Mining | 25,688 | 27,965 | 2,277 | 8.9 | 477,014,973 | 560,048,465 | 83,033,492 | 17.4 | 1,428 | 1,541 | 113 | 7.9 |
| Utilities | 2,495 | 2,486 | -9 | -0.4 | 47,360,811 | 53,726,298 | 6,365,487 | 13.4 | 1,460 | 1,662 | 202 | 13.8 |
| Construction | 24,617 | 22,988 | -1,629 | -6.6 | 293,302,820 | 281,778,736 | -11,524,084 | -3.9 | 917 | 943 | 26 | 2.8 |
| Manufacturing | 8,786 | 9,302 | 516 | 5.9 | 111,320,379 | 133,173,900 | 21,853,521 | 19.6 | 975 | 1,101 | 126 | 12.9 |
| Wholesale Trade | 8,496 | 8,909 | 413 | 4.9 | 113,274,718 | 123,894,669 | 10,619,951 | 9.4 | 1,026 | 1,070 | 44 | 4.3 |
| Retail Trade | 30,146 | 30,103 | -43 | -0.1 | 193,487,408 | 199,170,998 | 5,683,590 | 2.9 | 494 | 509 | 15 | 3.0 |
| Transportation & Warehousing | 9,179 | 9,564 | 385 | 4.2 | 104,014,887 | 115,655,915 | 11,641,028 | 11.2 | 872 | 930 | 58 | 6.7 |
| Information | 3,906 | 3,862 | -44 | -1.1 | 38,004,177 | 40,466,847 | 2,462,670 | 6.5 | 748 | 806 | 58 | 7.8 |
| Finance & Insurance | 6,776 | 6,679 | -97 | -1.4 | 76,861,291 | 79,717,871 | 2,856,580 | 3.7 | 873 | 918 | 45 | 5.2 |
| Real Estate & Rental & Leasing | 4,052 | 4,068 | 16 | 0.4 | 36,686,498 | 41,033,926 | 4,347,428 | 11.9 | 696 | 776 | 80 | 11.5 |
| Professional & Technical Services | 9,233 | 9,121 | -112 | -1.2 | 117,157,363 | 121,408,935 | 4,251,572 | 3.6 | 976 | 1,024 | 48 | 4.9 |
| Mgmt. of Companies & Enterprises | 866 | 860 | -6 | -0.7 | 16,973,699 | 17,369,222 | 395,523 | 2.3 | 1,508 | 1,554 | 46 | 3.1 |
| Administrative & Waste Services | 8,238 | 8,858 | 620 | 7.5 | 57,984,657 | 65,750,480 | 7,765,823 | 13.4 | 541 | 571 | 30 | 5.5 |
| Educational Services | 1,762 | 1,703 | -59 | -3.3 | 13,115,213 | 13,541,086 | 425,873 | 3.2 | 573 | 612 | 39 | 6.8 |
| Health Care & Social Assistance | 23,235 | 23,547 | 312 | 1.3 | 227,763,912 | 234,266,647 | 6,502,735 | 2.9 | 754 | 765 | 11 | 1.5 |
| Ambulatory Health Care Services | 8,768 | 8,993 | 225 | 2.6 | 119,143,660 | 124,383,304 | 5,239,644 | 4.4 | 1,045 | 1,064 | 19 | 1.8 |
| Hospitals | 3,291 | 3,277 | -14 | -0.4 | 43,099,506 | 41,621,728 | -1,477,778 | -3.4 | 1,007 | 977 | -30 | -3.0 |
| Nursing & Res. Care Facilities | 4,539 | 4,587 | 48 | 1.1 | 31,537,003 | 33,106,434 | 1,569,431 | 5.0 | 534 | 555 | 21 | 3.9 |
| Social Assistance | 6,637 | 6,690 | 53 | 0.8 | 33,983,743 | 35,155,181 | 1,171,438 | 3.4 | 394 | 404 | 10 | 2.5 |
| Arts, Entertainment, & Recreation | 3,475 | 3,485 | 10 | 0.3 | 18,525,113 | 19,198,617 | 673,504 | 3.6 | 410 | 424 | 14 | 3.4 |
| Accommodation & Food Services | 34,197 | 34,656 | 459 | 1.3 | 149,101,258 | 155,536,102 | 6,434,844 | 4.3 | 335 | 345 | 10 | 3.0 |
| Other Services | 8,131 | 8,579 | 448 | 5.5 | 78,408,810 | 73,571,549 | -4,837,261 | -6.2 | 742 | 660 | -82 | -11.1 |
| Total Government | 62,360 | 62,252 | -108 | -0.2 | $678,773,133 | $700,213,583 | $21,440,450 | 3.2 | $837 | $865 | $28 | 3.3 |
| Federal Government | 8,706 | 8,360 | -346 | -4.0 | 113,974,818 | 119,879,493 | 5,904,675 | 5.2 | 1,007 | 1,103 | 96 | 9.5 |
| State Government | 13,552 | 13,586 | 34 | 0.3 | 171,647,004 | 175,480,972 | 3,833,968 | 2.2 | 974 | 994 | 20 | 2.1 |
| State Government Education | 3,810 | 3,882 | 72 | 1.9 | 47,766,998 | 48,765,419 | 998,421 | 2.1 | 964 | 966 | 2 | 0.2 |
| Local Government | 40,102 | 40,307 | 205 | 0.5 | 393,151,311 | 404,853,118 | 11,701,807 | 3.0 | 754 | 773 | 19 | 2.5 |
| Local Government Education | 17,417 | 17,583 | 166 | 1.0 | 169,259,847 | 171,857,947 | 2,598,100 | 1.5 | 748 | 752 | 4 | 0.6 |
| Hospitals | 6,586 | 6,622 | 36 | 0.6 | 79,754,027 | 88,197,813 | 8,443,786 | 10.6 | 932 | 1,025 | 93 | 10.0 |
| aPreliminary. | ||||||||||||
| bNorth American Industry Classification System. | ||||||||||||
| Source: Quarterly Census of Employment and Wages, developed through a cooperative program between Research & Planning and the U.S. Bureau of Labor Statistics. | ||||||||||||
| Extract date: January 2012. | ||||||||||||
| Average Monthly Employment | Total Payroll | Average Weekly Wage | ||||||||||
|---|---|---|---|---|---|---|---|---|---|---|---|---|
| NAICSb Title | Third Quarter | Change | Third Quarter | Change | Third Quarter | Change | ||||||
| 2010 | 2011 | n | % | 2010 | 2011 | $ | % | 2010 | 2011 | $ | % | |
| Total, All Industries | 38,280 | 39,830 | 1,550 | 4.0 | $434,695,410 | $463,451,463 | $28,756,053 | 6.6 | $874 | $895 | $21 | 2.4 |
| Total Private | 32,847 | 34,440 | 1,593 | 4.8 | $370,923,974 | $397,689,248 | $26,765,274 | 7.2 | $869 | $888 | $19 | 2.2 |
| Agriculture | 140 | 127 | -13 | -9.3 | 759,646 | 749,983 | -9,663 | -1.3 | 417 | 454 | 37 | 8.9 |
| Mining | 3,324 | 3,955 | 631 | 19.0 | 66,612,402 | 85,418,147 | 18,805,745 | 28.2 | 1,542 | 1,661 | 119 | 7.7 |
| Utilities | 129 | 134 | 5 | 3.9 | 2,715,677 | 3,111,937 | 396,260 | 14.6 | 1,619 | 1,786 | 167 | 10.3 |
| Construction | 2,819 | 2,784 | -35 | -1.2 | 34,770,798 | 35,358,150 | 587,352 | 1.7 | 949 | 977 | 28 | 3.0 |
| Manufacturing | 1,603 | 1,769 | 166 | 10.4 | 19,264,638 | 21,388,701 | 2,124,063 | 11.0 | 924 | 930 | 6 | 0.6 |
| Wholesale Trade | 2,311 | 2,511 | 200 | 8.7 | 31,966,848 | 36,818,392 | 4,851,544 | 15.2 | 1,064 | 1,128 | 64 | 6.0 |
| Retail Trade | 4,680 | 4,739 | 59 | 1.3 | 32,625,974 | 33,620,234 | 994,260 | 3.0 | 536 | 546 | 10 | 1.9 |
| Transportation & Warehousing | 933 | 1,026 | 93 | 10.0 | 11,682,236 | 13,822,966 | 2,140,730 | 18.3 | 963 | 1,036 | 73 | 7.6 |
| Information | 495 | 476 | -19 | -3.8 | 4,403,972 | 4,880,015 | 476,043 | 10.8 | 684 | 789 | 105 | 15.4 |
| Finance & Insurance | 1,030 | 1,010 | -20 | -1.9 | 12,359,371 | 13,299,901 | 940,530 | 7.6 | 923 | 1,013 | 90 | 9.8 |
| Real Estate & Rental & Leasing | 861 | 895 | 34 | 3.9 | 8,236,976 | 10,677,120 | 2,440,144 | 29.6 | 736 | 918 | 182 | 24.7 |
| Professional & Technical Services | 1,382 | 1,425 | 43 | 3.1 | 17,192,238 | 19,706,410 | 2,514,172 | 14.6 | 957 | 1,064 | 107 | 11.2 |
| Mgmt. of Companies & Enterprises | 154 | 145 | -9 | -5.8 | 2,957,159 | 3,036,959 | 79,800 | 2.7 | 1,477 | 1,611 | 134 | 9.1 |
| Administrative & Waste Services | 1,458 | 1,481 | 23 | 1.6 | 10,344,365 | 11,304,354 | 959,989 | 9.3 | 546 | 587 | 41 | 7.5 |
| Educational Services | 99 | 116 | 17 | 17.2 | 586,077 | 710,191 | 124,114 | 21.2 | 455 | 471 | 16 | 3.5 |
| Health Care & Social Assistance | 5,532 | 5,586 | 54 | 1.0 | 66,139,786 | 64,434,617 | -1,705,169 | -2.6 | 920 | 887 | -33 | -3.6 |
| Ambulatory Health Care Services | 1,847 | 1,879 | 32 | 1.7 | 30,862,058 | 30,100,395 | -761,663 | -2.5 | 1,285 | 1,232 | -53 | -4.1 |
| Hospitals | 1,730 | 1,744 | 14 | 0.8 | 23,190,822 | 21,869,521 | -1,321,301 | -5.7 | 1,031 | 965 | -66 | -6.4 |
| Nursing & Residential Care Facilities | 942 | 927 | -15 | -1.6 | 7,009,872 | 7,030,799 | 20,927 | 0.3 | 572 | 583 | 11 | 1.9 |
| Social assistance | 1,013 | 1,035 | 22 | 2.2 | 5,077,034 | 5,433,902 | 356,868 | 7.0 | 386 | 404 | 18 | 4.7 |
| Arts, Entertainment, & Recreation | 568 | 594 | 26 | 4.6 | 3,986,901 | 4,167,843 | 180,942 | 4.5 | 540 | 540 | 0 | 0.0 |
| Accommodation & Food Services | 3,585 | 3,737 | 152 | 4.2 | 13,741,395 | 14,866,034 | 1,124,639 | 8.2 | 295 | 306 | 11 | 3.7 |
| Other Services | 1,745 | 1,929 | 184 | 10.5 | 30,577,515 | 20,317,294 | -10,260,221 | -33.6 | 1,348 | 810 | -538 | -39.9 |
| Total Government | 5,433 | 5,390 | -43 | -0.8 | $63,771,436 | $65,762,215 | $1,990,779 | 3.1 | $903 | $939 | $36 | 4.0 |
| Federal Government | 759 | 704 | -55 | -7.2 | 11,122,401 | 11,531,372 | 408,971 | 3.7 | 1,127 | 1,260 | 133 | 11.8 |
| State Government | 701 | 733 | 32 | 4.6 | 9,063,440 | 9,720,239 | 656,799 | 7.2 | 995 | 1,020 | 25 | 2.5 |
| Local Government | 3,972 | 3,952 | -20 | -0.5 | 43,585,595 | 44,510,604 | 925,009 | 2.1 | 844 | 866 | 22 | 2.6 |
| Local Government Education | ND | ND | ND | ND | ND | ND | ND | ND | ND | ND | ND | ND |
| aPreliminary. | ||||||||||||
| bNorth American Industry Classification System. | ||||||||||||
| ND-Not disclosable due to confidentiality of information. | ||||||||||||
| Source: Quarterly Census of Employment and Wages, developed through a cooperative program between Research & Planning and the U.S. Bureau of Labor Statistics. | ||||||||||||
| Extract date: January 2012. | ||||||||||||
| Average Monthly Employment | Total Payroll | Average Weekly Wage | ||||||||||
|---|---|---|---|---|---|---|---|---|---|---|---|---|
| NAICSb Title | Third Quarter | Change | Third Quarter | Change | Third Quarter | Change | ||||||
| 2010 | 2011 | n | % | 2010 | 2011 | $ | % | 2010 | 2011 | $ | % | |
| Total, All Industries | 42,980 | 43,538 | 558 | 1.3 | $418,565,229 | $455,896,263 | $37,331,034 | 8.9 | $749 | $805 | $56 | 7.5 |
| Total Private | 29,541 | 30,147 | 606 | 2.1 | $251,527,285 | $279,733,620 | $28,206,335 | 11.2 | $655 | $714 | $59 | 9.0 |
| Agriculture | 290 | 294 | 4 | 1.4 | 2,064,990 | 2,154,745 | 89,755 | 4.3 | 548 | 564 | 16 | 2.9 |
| Mining | 57 | 163 | 106 | 186.0 | 840,594 | 2,862,227 | 2,021,633 | 240.5 | 1,134 | 1,351 | 217 | 19.1 |
| Utilities | 137 | 134 | -3 | -2.2 | 2,531,336 | 2,594,989 | 63,653 | 2.5 | 1,421 | 1,490 | 69 | 4.9 |
| Construction | 2,885 | 2,973 | 88 | 3.1 | 30,013,374 | 33,774,867 | 3,761,493 | 12.5 | 800 | 874 | 74 | 9.3 |
| Manufacturing | 1,446 | 1,486 | 40 | 2.8 | 19,007,432 | 26,956,346 | 7,948,914 | 41.8 | 1,011 | 1,395 | 384 | 38.0 |
| Wholesale Trade | 816 | 819 | 3 | 0.4 | 9,718,465 | 10,354,271 | 635,806 | 6.5 | 916 | 973 | 57 | 6.2 |
| Retail Trade | 5,157 | 5,338 | 181 | 3.5 | 33,030,748 | 36,338,039 | 3,307,291 | 10.0 | 493 | 524 | 31 | 6.3 |
| Transportation & Warehousing | 2,271 | 2,359 | 88 | 3.9 | 22,908,929 | 24,659,879 | 1,750,950 | 7.6 | 776 | 804 | 28 | 3.6 |
| Information | 1,086 | 1,098 | 12 | 1.1 | 11,840,642 | 12,903,275 | 1,062,633 | 9.0 | 839 | 904 | 65 | 7.7 |
| Finance & Insurance | 1,620 | 1,633 | 13 | 0.8 | 18,012,443 | 19,168,241 | 1,155,798 | 6.4 | 855 | 903 | 48 | 5.6 |
| Real Estate & Rental & Leasing | 518 | 529 | 11 | 2.1 | 4,252,246 | 4,636,461 | 384,215 | 9.0 | 631 | 674 | 43 | 6.8 |
| Professional & Technical Services | 1,493 | 1,486 | -7 | -0.5 | 18,855,316 | 20,194,376 | 1,339,060 | 7.1 | 971 | 1,045 | 74 | 7.6 |
| Mgmt. of Companies & Enterprises | 74 | 57 | -17 | -23.0 | 996,826 | 862,707 | -134,119 | -13.5 | 1,036 | 1,164 | 128 | 12.4 |
| Administrative & Waste Services | 1,797 | 1,812 | 15 | 0.8 | 11,074,188 | 11,368,323 | 294,135 | 2.7 | 474 | 483 | 9 | 1.9 |
| Educational Services | 215 | 221 | 6 | 2.8 | 1,466,921 | 1,452,856 | -14,065 | -1.0 | 525 | 506 | -19 | -3.6 |
| Health Care & Social Assistance | 3,873 | 3,944 | 71 | 1.8 | 38,942,561 | 41,463,162 | 2,520,601 | 6.5 | 773 | 809 | 36 | 4.7 |
| Ambulatory Health Care Services | 1,802 | 1,868 | 66 | 3.7 | 26,238,937 | 28,490,405 | 2,251,468 | 8.6 | 1,120 | 1,173 | 53 | 4.7 |
| Nursing & Residential Care Facilties | 882 | 854 | -28 | -3.2 | 6,421,398 | 6,291,614 | -129,784 | -2.0 | 560 | 567 | 7 | 1.3 |
| Hospitals & Social Assistance | 1,189 | 1,222 | 33 | 2.8 | 6,282,226 | 6,681,143 | 398,917 | 6.3 | 406 | 421 | 15 | 3.7 |
| Arts, Entertainment, & Recreation | 309 | 302 | -7 | -2.3 | 910,371 | 988,170 | 77,799 | 8.5 | 227 | 252 | 25 | 11.0 |
| Accommodation & Food Services | 4,242 | 4,250 | 8 | 0.2 | 16,012,289 | 17,280,783 | 1,268,494 | 7.9 | 290 | 313 | 23 | 7.9 |
| Other Services | 1,256 | 1,249 | -7 | -0.6 | 9,047,614 | 9,719,903 | 672,289 | 7.4 | 554 | 599 | 45 | 8.1 |
| Total Government | 13,438 | 13,392 | -46 | -0.3 | $167,037,944 | $176,162,643 | $9,124,699 | 5.5 | $956 | $1,012 | $56 | 5.9 |
| Federal Government | 2,697 | 2,681 | -16 | -0.6 | 39,136,281 | 42,867,893 | 3,731,612 | 9.5 | 1,116 | 1,230 | 114 | 10.2 |
| State Government | 3,996 | 3,977 | -19 | -0.5 | 56,460,441 | 57,046,088 | 585,647 | 1.0 | 1,087 | 1,103 | 16 | 1.5 |
| Local Government | 6,745 | 6,733 | -12 | -0.2 | 71,441,222 | 76,248,662 | 4,807,440 | 6.7 | 815 | 871 | 56 | 6.9 |
| Local Government Education | 3,342 | 3,351 | 9 | 0.3 | 35,665,051 | 36,715,942 | 1,050,891 | 2.9 | 821 | 843 | 22 | 2.7 |
| aPreliminary. | ||||||||||||
| bNorth American Industry Classification System. | ||||||||||||
| Source: Quarterly Census of Employment and Wages, developed through a cooperative program between Research & Planning and the U.S. Bureau of Labor Statistics. | ||||||||||||
| Extract date: January 2012. | ||||||||||||
aDue to space considerations, tables for Natrona and Laramie counties appear in the online version of this article only.