Wyoming Normalizeda Unemployment Insurance Statistics: Initial Claims
by: Patrick Harris, Principal Economist
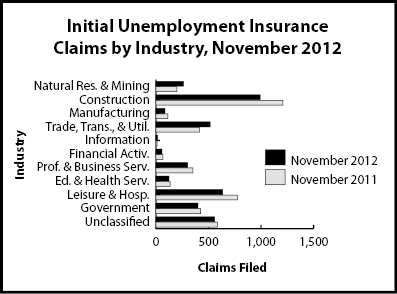
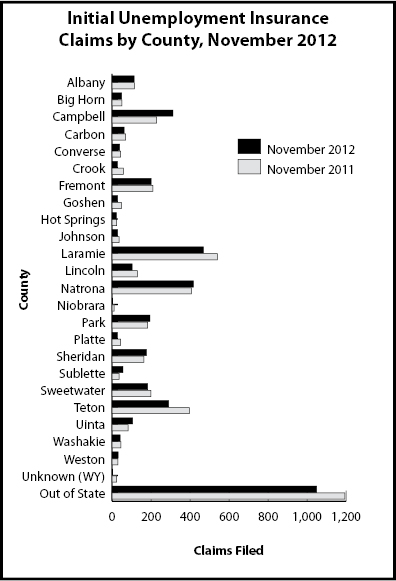
Initial claims decreased over the year, but significant increases were seen in wholesale trade (146.7%), information (33.3%), and natural resources & mining (30.0%).
|
Initial Claims
|
Claims Filed
|
Percent Change Claims Filed
|
Nov
2012 |
Nov
2012 |
Nov
2012 |
Oct
2012 |
Nov
2011 |
Oct
2012 |
Nov
2011 |
|
Wyoming Statewide
|
|
TOTAL CLAIMS FILED
|
4,027
|
4,357
|
4,368
|
-7.6
|
-7.8
|
|
TOTAL GOODS-PRODUCING
|
1,337
|
1,112
|
1,521
|
20.2
|
-12.1
|
|
Natural Res. & Mining
|
260
|
244
|
200
|
6.6
|
30.0
|
|
Mining
|
229
|
212
|
157
|
8.0
|
45.9
|
|
Oil & Gas Extraction
|
16
|
10
|
10
|
60.0
|
60.0
|
|
Construction
|
991
|
807
|
1,207
|
22.8
|
-17.9
|
|
Manufacturing
|
85
|
61
|
113
|
39.3
|
-24.8
|
|
TOTAL SERVICE-PROVIDING
|
1,733
|
2,463
|
1,836
|
-29.6
|
-5.6
|
|
Trade, Transp., & Utilities
|
515
|
557
|
414
|
-7.5
|
24.4
|
|
Wholesale Trade
|
185
|
206
|
75
|
-10.2
|
146.7
|
|
Retail Trade
|
191
|
228
|
231
|
-16.2
|
-17.3
|
|
Transp., Warehousing & Utilities
|
139
|
123
|
108
|
13.0
|
28.7
|
|
Information
|
16
|
16
|
12
|
0.0
|
33.3
|
|
Financial Activities
|
56
|
67
|
65
|
-16.4
|
-13.8
|
|
Prof. & Business Svcs.
|
300
|
264
|
352
|
13.6
|
-14.8
|
|
Educational & Health Svcs.
|
122
|
142
|
134
|
-14.1
|
-9.0
|
|
Leisure & Hospitality
|
634
|
1,323
|
774
|
-52.1
|
-18.1
|
|
Other Svcs., exc. Public Admin.
|
84
|
87
|
80
|
-3.4
|
5.0
|
|
TOTAL GOVERNMENT
|
399
|
355
|
425
|
12.4
|
-6.1
|
|
Federal Government
|
258
|
203
|
254
|
27.1
|
1.6
|
|
State Government
|
27
|
30
|
34
|
-10.0
|
-20.6
|
|
Local Government
|
113
|
121
|
135
|
-6.6
|
-16.3
|
|
Local Education
|
20
|
22
|
32
|
-9.1
|
-37.5
|
|
UNCLASSIFIED
|
557
|
426
|
584
|
30.8
|
-4.6
|
|
Laramie County
|
|
TOTAL CLAIMS FILED
|
467
|
445
|
540
|
4.9
|
-13.5
|
|
TOTAL GOODS-PRODUCING
|
193
|
155
|
245
|
24.5
|
-21.2
|
|
Construction
|
184
|
138
|
230
|
33.3
|
-20.0
|
|
TOTAL SERVICE-PROVIDING
|
222
|
222
|
236
|
0.0
|
-5.9
|
|
Trade, Transp., & Utilities
|
90
|
60
|
75
|
50.0
|
20.0
|
|
Financial Activities
|
10
|
19
|
12
|
-47.4
|
-16.7
|
|
Prof. & Business Svcs.
|
52
|
60
|
70
|
-13.3
|
-25.7
|
|
Educational & Health Svcs.
|
20
|
23
|
28
|
-13.0
|
-28.6
|
|
Leisure & Hospitality
|
35
|
37
|
32
|
-5.4
|
9.4
|
|
TOTAL GOVERNMENT
|
28
|
45
|
32
|
-37.8
|
-12.5
|
|
UNCLASSIFIED
|
22
|
23
|
25
|
-4.3
|
-12.0
|
|
Natrona County
|
|
TOTAL CLAIMS FILED
|
416
|
357
|
407
|
16.5
|
2.2
|
|
TOTAL GOODS-PRODUCING
|
156
|
113
|
191
|
38.1
|
-18.3
|
|
Construction
|
113
|
75
|
161
|
50.7
|
-29.8
|
|
TOTAL SERVICE-PROVIDING
|
234
|
226
|
187
|
3.5
|
25.1
|
|
Trade, Transp., & Utilities
|
89
|
121
|
52
|
-26.4
|
71.2
|
|
Financial Activities
|
6
|
8
|
7
|
-25.0
|
-14.3
|
|
Prof. & Business Svcs.
|
51
|
25
|
47
|
104.0
|
8.5
|
|
Educational & Health Svcs.
|
35
|
20
|
28
|
75.0
|
25.0
|
|
Leisure & Hospitality
|
38
|
30
|
33
|
26.7
|
15.2
|
|
TOTAL GOVERNMENT
|
11
|
12
|
18
|
-8.3
|
-38.9
|
|
UNCLASSIFIED
|
12
|
6
|
9
|
100.0
|
33.3
|
| aAn average month is considered 4.33 weeks. If a month has four weeks, the normalization factor is 1.0825. If the month has five weeks, the normalization factor is 0.866. The number of raw claims is multiplied by the normalization factor to achieve the normalized claims counts. |
|


|
Last modified
by Phil Ellsworth.


