RP_logo

Contents

PDF Version
Title Page and Credits
Introduction
Response Rates and Methodology
Table 1: Response Rates by Survey Quarter, Wyoming Benefits Survey, 2008
Survey Results
Figure 1: Percentage of Employees in Wyoming by Full- and Part-Time Status, 2008
Figure 2: Wyoming Compensation Costs as a Percentage of Total Compensation, 2008
Table 2: Percentage of Employers Offering Selected Benefits to Their Full- and Part-Time Employees in Wyoming, 2004-2008
Table 3a: Number and Percentage of Full- and Part-Time Employees Offered Selected Benefits in Wyoming by Number of Employees Per Firm, 2008
Figure 3: Percentage of Employers in Wyoming Offering and Percentage of Full-Time Workers Offered Health Insurance by Employer Size, 2008
Figure 4: Percentage of Employers in Wyoming Offering and Percentage of Full-Time Workers Offered a Retirement Plan by Employer Size, 2008
Table 3b: Number and Percentage of Wyoming Employers Offering Selected Benefits to Their Full- and Part-Time Employees in Wyoming by Number of Employees Per Firm, 2008
Table 4: Percentage of Full- and Part-Time Employees Offered Selected Benefits in Wyoming, 2004-2008
Figure 5: Percentage of Full-Time Employees in Wyoming Offered Health Insurance and Dependent Health Insurance, 2004-2008
Figure 6: Number and Percentage of Employees (Full- and Part-Time) in Wyoming Offered Health Insurance by Industry, 2008
Table 5: Percentage of Full- and Part-Time Employees Offered Selected Benefits in Wyoming by Industry, 2008
Figure 7: Percentage of Wyoming Employers Offering and Percentage of Full-Time Workers Offered Health Insurance by Industry, 2008
Figure 8: Percentage of Wyoming Employers Offering and Percentage of Full-Time Workers Offered a Retirement Plan by Industry, 2008
Table 6: Of Full-Time Employees Offered a Retirement Plan, Percentage of Employees Offered a Defined-Contribution or Defined-Benefit Retirement Plan in Wyoming by Industry, 2008
Table 7: Of Employees Offered a Retirement Plan, Percentage of Employees Offered a Defined-Contribution or Defined-Benefit Retirement Plan in Wyoming by Number of Employees Per Firm, 2008
Table 8: Average Percentage of Wyoming Employees Who Were Offered Insurance and Retirement Plans and Chose to Enroll, 2008
Figure 9: Percentage of Wyoming Employers Offering and Full-Time Workers Offered Retirement Benefits by Employer Size, 2008
Figure 10: Average Percentage of Wyoming Full-Time Employees Who Were Offered Insurance and Retirement Plans and Chose to Enroll, 2007 and 2008
Table 9: Amount Paid for Benefits by Employers for Wyoming Employees, 2008
Table 10: Average Number of Days of Leave Benefits for Wyoming Employees, 2008
Summary
References

Summary

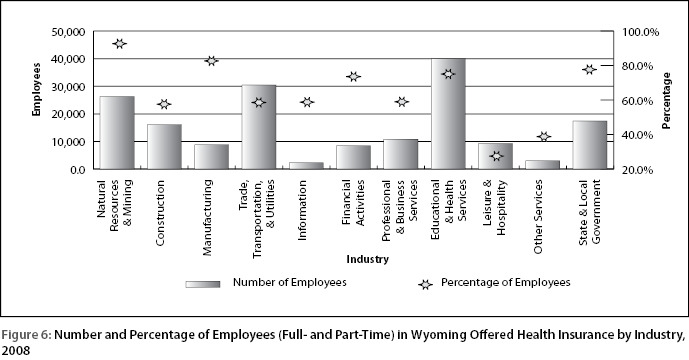
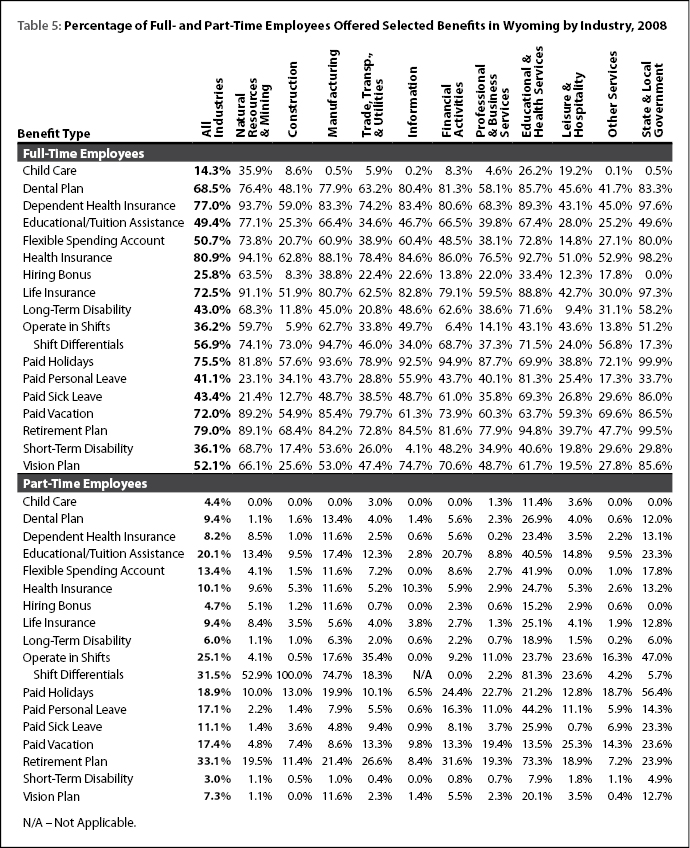
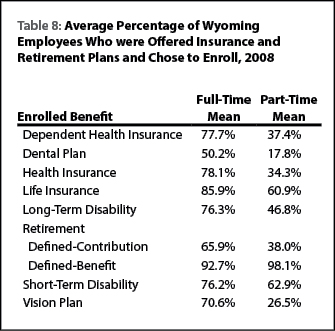
Approximately three-fourths of full-time employees in Wyoming were offered benefits during 2008. The likelihood of being offered benefits varied greatly and depended on industry type and employer size. Employees in state & local government, educational & health services, and natural resources & mining were most likely to be offered benefits, and large firms were more likely than smaller firms to offer most benefits. 
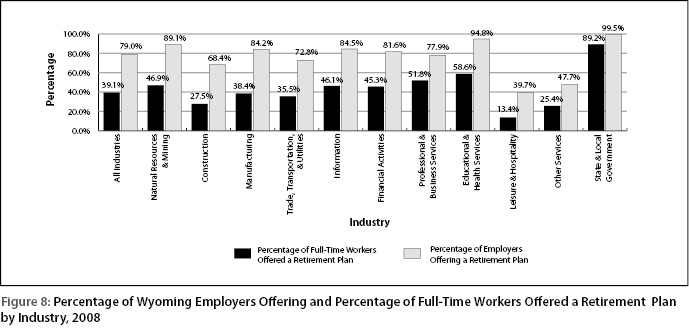
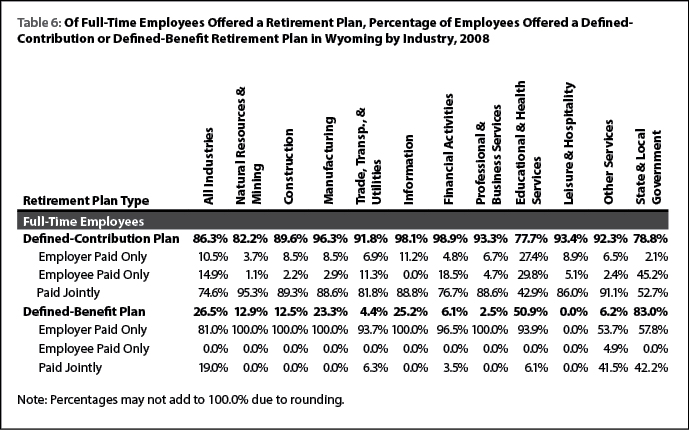
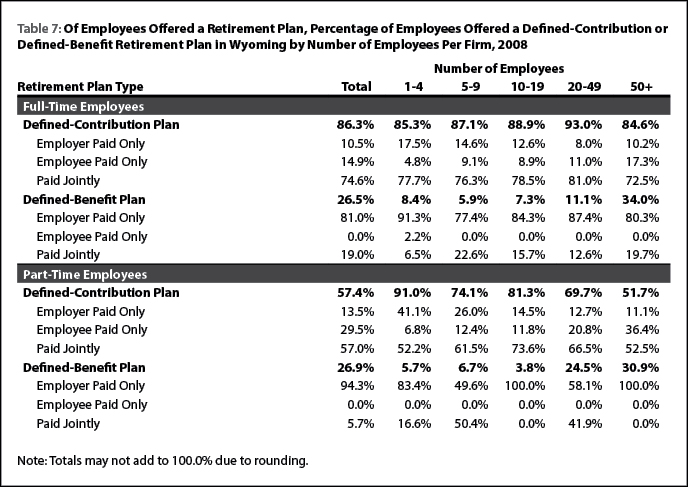
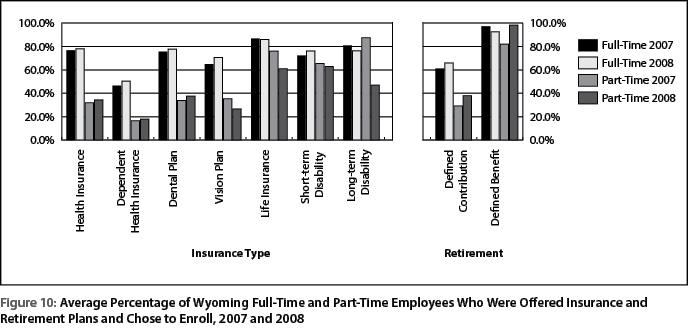
Overall, most employees were offered defined-contribution retirement plans, but not as many were offered defined-benefit retirement plans. Employees in large companies and in state and local government were most likely to be offered defined-benefit plans.

< Previous | Next >