Survey Results
A good
indicator of whether an employee will 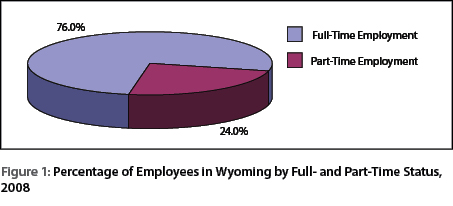 be
offered benefits is full-time or part-time work status. Figure
1 shows that in 2008 just over three-fourths
(76.0%) of employees held full-time positions while the other 24.0% worked
part-time.
be
offered benefits is full-time or part-time work status. Figure
1 shows that in 2008 just over three-fourths
(76.0%) of employees held full-time positions while the other 24.0% worked
part-time.
Total compensation refers to the amount of money an employer spends on wages
combined with the amount spent on other benefits. Contributions to 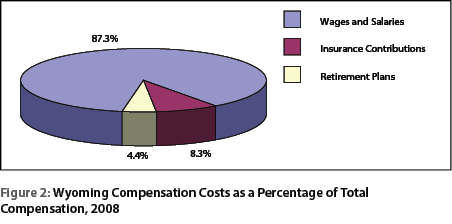 insurance
plans and retirement plans represent the majority of total compensation other
than wages. In 2008, 4.4% of total compensation consisted of contributions
to retirement plans and 8.3% went to insurance costs (see Figure
2).
insurance
plans and retirement plans represent the majority of total compensation other
than wages. In 2008, 4.4% of total compensation consisted of contributions
to retirement plans and 8.3% went to insurance costs (see Figure
2).
Table 2 shows the proportion of employers
that offered benefits to their 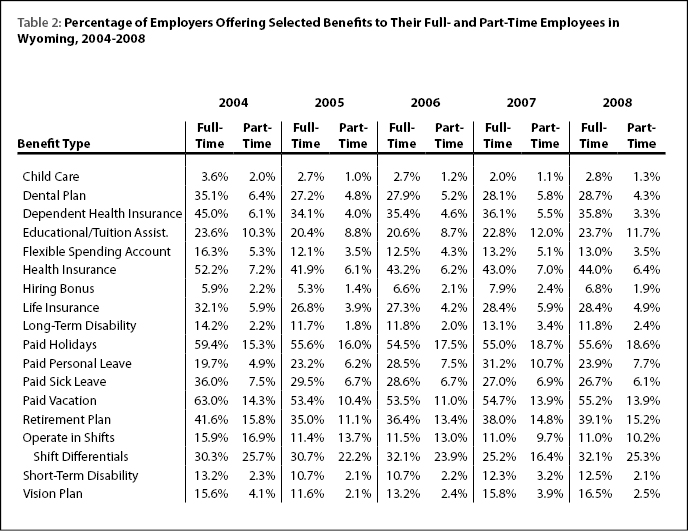 employees by full- and part-time status.
In all cases, a greater proportion of employers offered benefits to full-time
employees than to part-time employees. In 2008 paid holidays was the
benefit most often offered to full-time employees (55.6%) followed by
paid vacation (55.2%), and health insurance (44.0%). Approximately 39.1%
of employers offered retirement benefits to their full-time employees.
In comparison, the benefits most often offered to part-time employees
included shift differentials (25.3%), paid holidays (18.6%), and retirement
plans (15.2%). Only 6.4% of employers offered their part-time employees
health insurance.
employees by full- and part-time status.
In all cases, a greater proportion of employers offered benefits to full-time
employees than to part-time employees. In 2008 paid holidays was the
benefit most often offered to full-time employees (55.6%) followed by
paid vacation (55.2%), and health insurance (44.0%). Approximately 39.1%
of employers offered retirement benefits to their full-time employees.
In comparison, the benefits most often offered to part-time employees
included shift differentials (25.3%), paid holidays (18.6%), and retirement
plans (15.2%). Only 6.4% of employers offered their part-time employees
health insurance.
Table 3a shows the number of employees that were offered
benefits in 2008 by firm size for full- and part-time employees. The
largest firms offered the largest number of benefits to both full- and
part-time employees. Of the 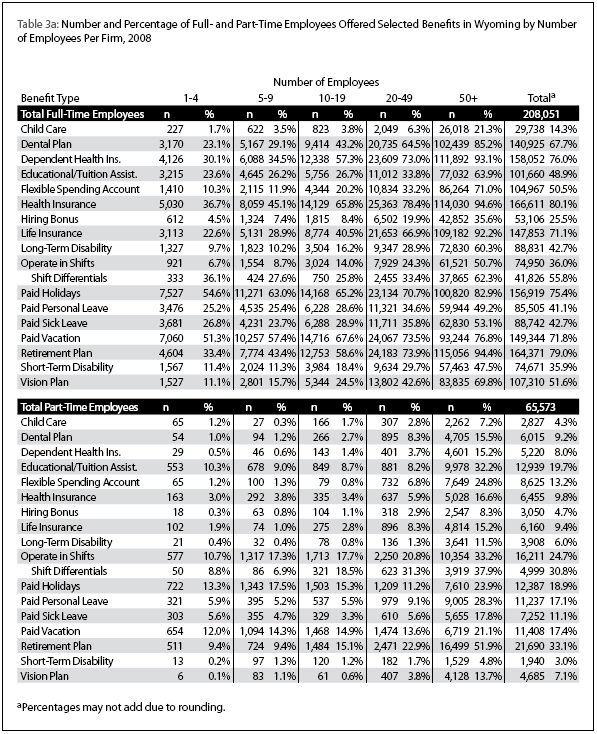 166,611 full-time employees who were offered
health insurance, 114,030 worked in firms with 50 or more employees,
while only 5,030 of those working for firms with 1-4 employees were offered
the same benefit. Similarly, 115,056 full-time employees working for
the state’s largest firms received retirement benefits compared to 4,604
working for the state’s smallest firms.
166,611 full-time employees who were offered
health insurance, 114,030 worked in firms with 50 or more employees,
while only 5,030 of those working for firms with 1-4 employees were offered
the same benefit. Similarly, 115,056 full-time employees working for
the state’s largest firms received retirement benefits compared to 4,604
working for the state’s smallest firms.
Similarly, more part-time employees working for large firms were offered benefits than those working for small firms. Out of 65,573 part-time workers in the state, 21,690 were offered retirement benefits; more than three-fourths (16,499) of whom worked for large firms. In contrast, only 511 of those working part-time for firms with 1-4 employees were offered retirement benefits. Only 6,455 of 65,573 part-time employees in the state were offered health insurance benefits during 2008. Of those, 5,028 worked for firms with 50 or more employees.
The percentage of employers offering health insurance increased with the
number of employees, as did the proportion of employees who were offered
the benefit (see Figure 3). Among
firms with 1-4 employees, 32.0% of  employers offered health insurance and
36.7% of employees in firms this size were offered the insurance. In comparison,
91.3% of employers with 50 or more workers offered health insurance and
it was offered to 94.6% of employees in firms this size.
employers offered health insurance and
36.7% of employees in firms this size were offered the insurance. In comparison,
91.3% of employers with 50 or more workers offered health insurance and
it was offered to 94.6% of employees in firms this size.
The same pattern occurred for retirement benefits (see
Figure 4). Approximately 28.3% of the smallest firms (1-4 employees)
offered this benefit to their employees and approximately one-third (33.4%)
of  employees in firms this size were offered the benefit. For the largest
firms (50+ employees), 88.6% of firms offered retirement benefits and
94.4% of their employees were offered a retirement plan.
employees in firms this size were offered the benefit. For the largest
firms (50+ employees), 88.6% of firms offered retirement benefits and
94.4% of their employees were offered a retirement plan.
Table 3b shows
a larger proportion of large firms offered their
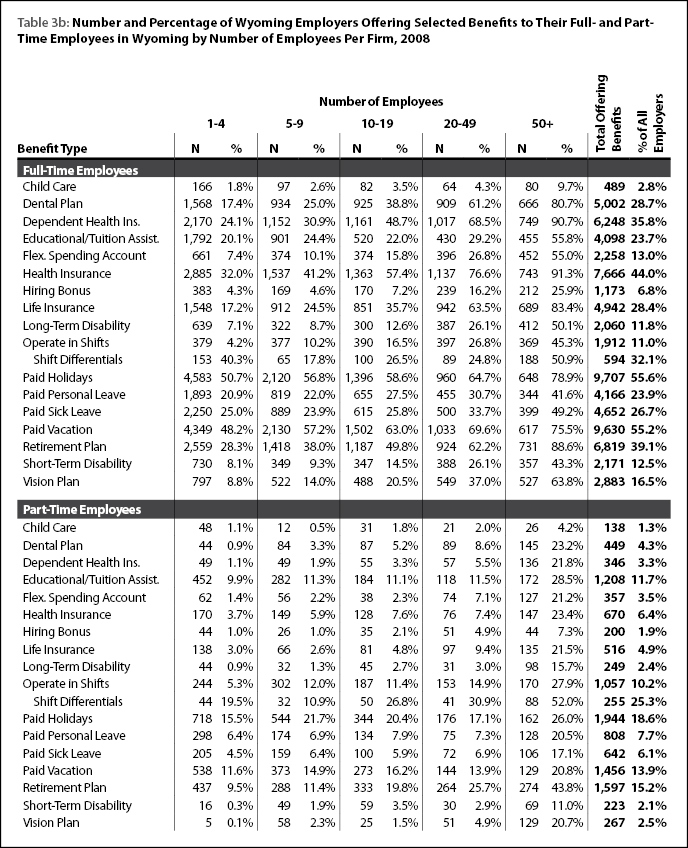 employees benefits compared to smaller firms. In general, the smallest proportion
of firms offering benefits were those with 1-4 employees and that proportion
increased as firm size increased. For example, 17.4% of firms with 1-4 employees,
38.8% of firms with 10-19 employees, and 80.7% of firms with 50 or more employees
offered dental plans to their full-time employees. In 2008, 32.0% of firms
with 1-4 employees offered their full-time employees health insurance compared
to 91.3% of firms with 50 or more employees. Just over one-quarter (28.3%)
of small firms offered retirement plans to their full-time employees while
88.6% of large firms offered this benefit.
employees benefits compared to smaller firms. In general, the smallest proportion
of firms offering benefits were those with 1-4 employees and that proportion
increased as firm size increased. For example, 17.4% of firms with 1-4 employees,
38.8% of firms with 10-19 employees, and 80.7% of firms with 50 or more employees
offered dental plans to their full-time employees. In 2008, 32.0% of firms
with 1-4 employees offered their full-time employees health insurance compared
to 91.3% of firms with 50 or more employees. Just over one-quarter (28.3%)
of small firms offered retirement plans to their full-time employees while
88.6% of large firms offered this benefit.
The results were similar for part-time employees. Fewer firms offered benefits to part-time employees, and larger firms offered benefits more often than smaller firms. Only 3.7% of firms with 1-4 employees offered health insurance benefits to part-time employees while nearly one-quarter (23.4%) with 50 or more employees did. Less than 1 in 10 (9.5%) small firms offered retirement benefits to part-time employees, compared to 43.8% of the largest firms.
In 2008, the benefit offered to the greatest percentage of full-time 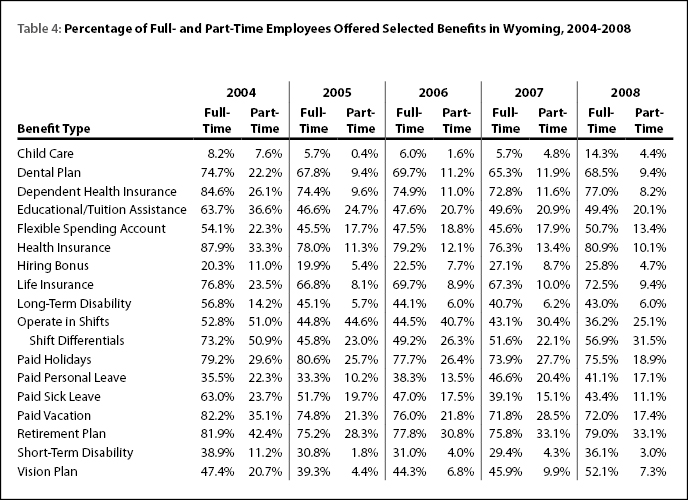 employees
was health insurance (80.9%, Table 4), followed by retirement plans (79.0%),
and dependent health insurance (77.0%). The benefits most often offered to
part-time employees were retirement plans (33.1%), followed by shift differentials
(31.5%), and educational/tuition assistance (20.1%).
employees
was health insurance (80.9%, Table 4), followed by retirement plans (79.0%),
and dependent health insurance (77.0%). The benefits most often offered to
part-time employees were retirement plans (33.1%), followed by shift differentials
(31.5%), and educational/tuition assistance (20.1%).
Table 4 also shows trends over time in the percentage
of employees that were offered benefits. In general, the percentage of
full-time employees offered benefits increased from 2007 while the proportion
of part-time employees offered benefits either  declined or did not change.
As shown in Figure 5, the proportion of full-time employees offered health
insurance benefits increased in 2008, as did the proportion of full-time
employees who were offered dependent health care benefits.
declined or did not change.
As shown in Figure 5, the proportion of full-time employees offered health
insurance benefits increased in 2008, as did the proportion of full-time
employees who were offered dependent health care benefits.
The number and percentage of employees offered benefits varied widely by
industry (Figure 6). Some industries were more likely to offer a more generous
benefits package than others. It is likely that the seasonal nature 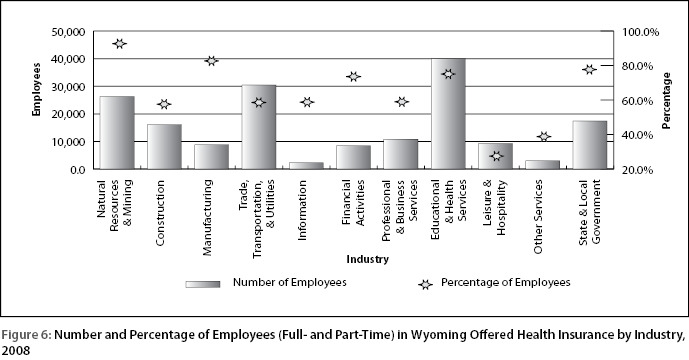 of
the specific industry drives the benefit structure. For example, it may
not be as cost effective to offer benefits to a seasonal work force in
leisure & hospitality
or construction as it is for a more permanent work force found in educational & health
services or state & local government. Benefits may also be used to attract
employees to growing industries such as natural resources & mining.
of
the specific industry drives the benefit structure. For example, it may
not be as cost effective to offer benefits to a seasonal work force in
leisure & hospitality
or construction as it is for a more permanent work force found in educational & health
services or state & local government. Benefits may also be used to attract
employees to growing industries such as natural resources & mining.
As shown in Table 5, the percentage of full- and part-time
employees who were offered benefits varied by industry with certain benefits
more prevalent in some industries. For example, although child care was
offered to only 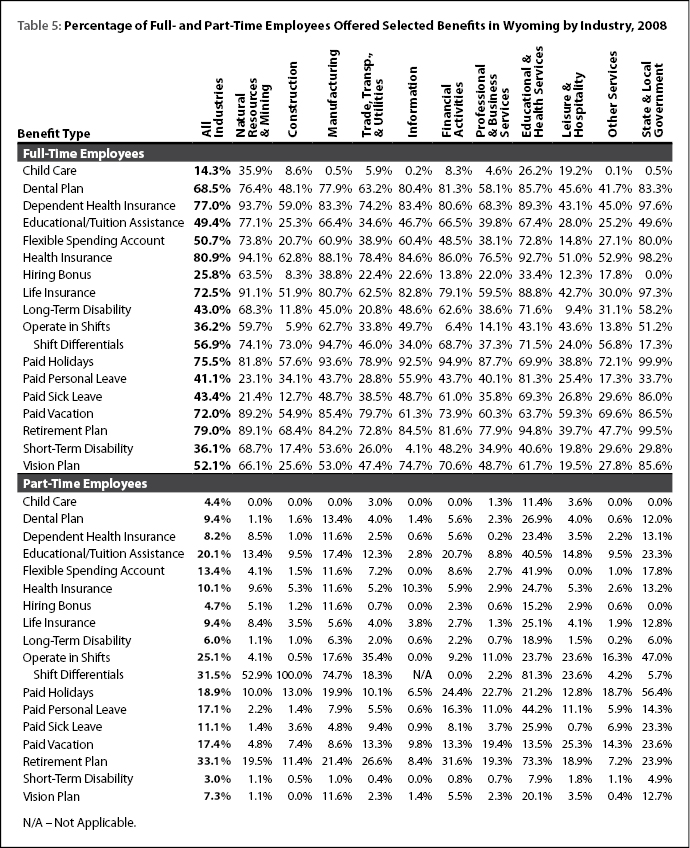 14.3% of full-time employees across all industries, 35.9%
of full-time employees in natural resources & mining were offered this benefit, followed
by 26.2% in educational & health services. Similarly, firms in natural
resources & mining and manufacturing offered short-term disability benefits
to a greater proportion of full-time employees (68.7% and 53.6%, respectively)
compared to all industries (36.1%). State & local government and firms
in natural resources & mining offered health insurance benefits to the
largest proportion of full-time workers (98.2% and 94.1%, respectively).
State & local government also offered retirement benefits to the greatest
proportion of full-time workers (99.5%) followed by educational & health
services (94.8%).
14.3% of full-time employees across all industries, 35.9%
of full-time employees in natural resources & mining were offered this benefit, followed
by 26.2% in educational & health services. Similarly, firms in natural
resources & mining and manufacturing offered short-term disability benefits
to a greater proportion of full-time employees (68.7% and 53.6%, respectively)
compared to all industries (36.1%). State & local government and firms
in natural resources & mining offered health insurance benefits to the
largest proportion of full-time workers (98.2% and 94.1%, respectively).
State & local government also offered retirement benefits to the greatest
proportion of full-time workers (99.5%) followed by educational & health
services (94.8%).
 Firms
in natural resources & mining offered a large
proportion of their full-time employees most of the benefits included
in this survey. Figures
7and 8 show that approximately
9 of 10 employees (94.1%) were offered
Firms
in natural resources & mining offered a large
proportion of their full-time employees most of the benefits included
in this survey. Figures
7and 8 show that approximately
9 of 10 employees (94.1%) were offered 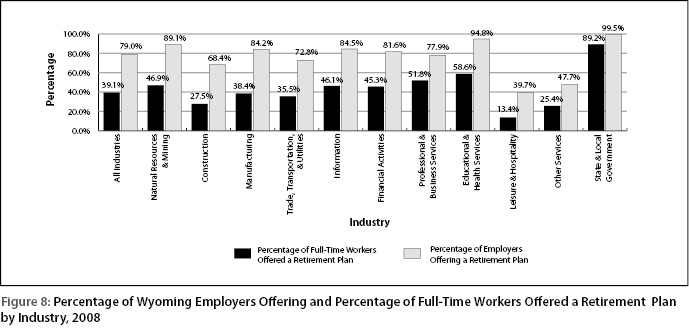 health insurance and retirement
plans (89.1%). There were only three benefits these firms did not offer
to more than half of their employees: paid personal leave (23.1%), paid
sick leave (21.4%), and child care benefits (35.9%).
health insurance and retirement
plans (89.1%). There were only three benefits these firms did not offer
to more than half of their employees: paid personal leave (23.1%), paid
sick leave (21.4%), and child care benefits (35.9%).
The proportion of employees in the construction industry who were offered benefits was lower than the average for all industries. While 80.9% of employees in all industries were offered health insurance, only 62.8% of construction employees were. Similarly, 79.0% of all employees received retirement benefits compared to 68.4% of those working in construction. The percentage of employees in construction who were offered dependent health insurance was 59.0%, compared to 77.0% for all industries.
An above-average proportion of manufacturing employees were offered health insurance (88.1%) and retirement benefits (84.2%). Approximately 83.3% of these employees were offered dependent health care as well. Manufacturing firms offered 93.6% of employees paid holidays, and 85.4% were offered paid vacation time.
Trade, transportation, & utilities includes a wide variety of firms; retail stores, trucking companies, and electrical power plants. In 2008, 78.4% of employees in these firms were offered health insurance, which was similar to the average for the state (80.9%). A slightly lower-than-average percentage was offered retirement benefits (72.8%) and 74.2% were offered dependent health insurance.
More full-time employees in the information industry were offered health insurance (84.6%) and retirement benefits (84.5%) than the state average (80.9% and 79.0%, respectively). More than three-fourths of these employees were offered dependent health insurance plans and a similar proportion (74.7%) were offered vision plans.
Compared to full-time workers in all industries, employees in the financial activities industry were more likely to be offered most of the benefits. Approximately 86.0% in this industry were offered health insurance benefits, 80.6% were offered dependent health care benefits, and 81.6% were offered retirement benefits. A greater-than-average proportion of these employees also were offered a dental plan (81.3%), a vision plan (70.6%), and paid vacation time (73.9%).
The professional & business services sector includes a wide range of firms including temporary help agencies, engineering firms, landscaping & snow removal services, and law offices. Compared to the average for all industries in Wyoming, full-time employees in this industry were somewhat less likely to be offered many benefits. An estimated 76.5% were offered health insurance, 68.3% were offered dependent health benefits, and 77.9% were offered retirement benefits. Paid holidays were offered to 87.7% of these employees, and paid vacation time was offered to 60.3%.
The educational & health services industry includes both private and public employers, such as school districts, hospitals, doctor’s offices, and colleges and universities. They include a full range of employer sizes, ranging from very small to very large. Overall, full-time employees in this industry were more likely to be offered health insurance (92.7%) compared to the state average. They were also more likely to be offered retirement benefits (94.8%) and dependent health benefits (89.3%).
Leisure & hospitality is a highly seasonal industry that includes hotels, restaurants, and museums. This industry offered benefits to the smallest proportion of full-time employees compared to the state average. Just over half (51.0%) of full-time workers in this industry were offered health insurance benefits and 39.7% were offered retirement benefits. Approximately 43.1% were offered dependent health care benefits, 38.8% were offered paid holidays, and 59.3% were offered paid vacation time.
Other services includes businesses such as automotive repair services, hair salons, membership organizations, and commercial laundries. Only 52.9% of full-time employees in this sector were offered health insurance benefits compared to the state average of 80.9%. Likewise, 47.7% of these employees were offered retirement benefits compared to the average of 79.0%.
Full-time employees working in state & local government were very likely to be offered benefits. Nearly all employees in this sector were offered health insurance (98.2%) and retirement benefits (99.5%). Full-time employees were also very likely to be offered other benefits such as paid holidays (99.9%) and paid vacation time (86.5%), dental plans (83.3%) and vision plans (85.6%), and dependent health insurance (97.6%).
Table 6 provides details on the types of retirement
plans offered by 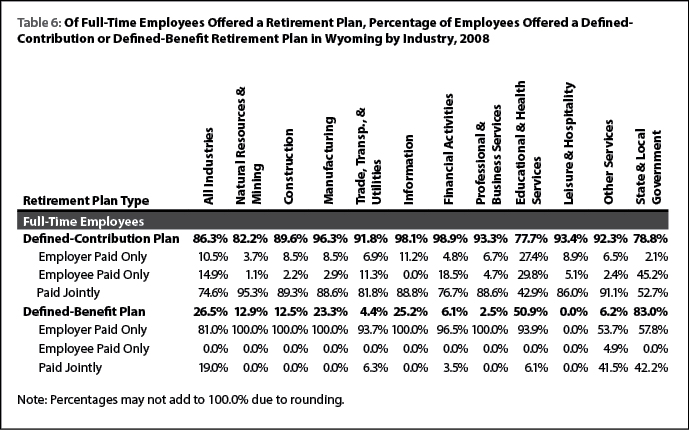 employers. There are two basic types of plans: defined-contribution
and defined-benefit. In a defined-contribution plan, employees and/or
employers make specific contributions, such as a certain percentage of
wages from each pay period. Benefits from this type of retirement account
typically depend on the amount contributed and the investment’s performance.
Defined-contribution plans are generally designed to be flexible and
portable. An example of this type of account is a 401K account.
employers. There are two basic types of plans: defined-contribution
and defined-benefit. In a defined-contribution plan, employees and/or
employers make specific contributions, such as a certain percentage of
wages from each pay period. Benefits from this type of retirement account
typically depend on the amount contributed and the investment’s performance.
Defined-contribution plans are generally designed to be flexible and
portable. An example of this type of account is a 401K account.
In comparison, defined-benefit plans provide a set amount of benefits after retirement based on a set formula. Defined-benefit plans include pension plans where the benefits are related to the employee’s years of service and highest salary. Sometimes employers offer both a defined-benefit plan and a defined-contribution plan.
Overall, defined-contribution plans (86.3%) were offered to full-time employees more often than defined-benefit plans (26.5%), but there was some variation among industries. For example, 83.0% of full-time employees in state & local government and 50.9% of educational & health service employees were offered defined-benefit plans. In contrast, those in leisure & hospitality (0.0%), professional & business services (2.5%), and trade, transportation, & utilities (4.4%) were least likely to be offered this type of plan. A majority of full-time employees in all industries were offered a defined-contribution plan.
Employees in larger firms were more often offered defined-benefit
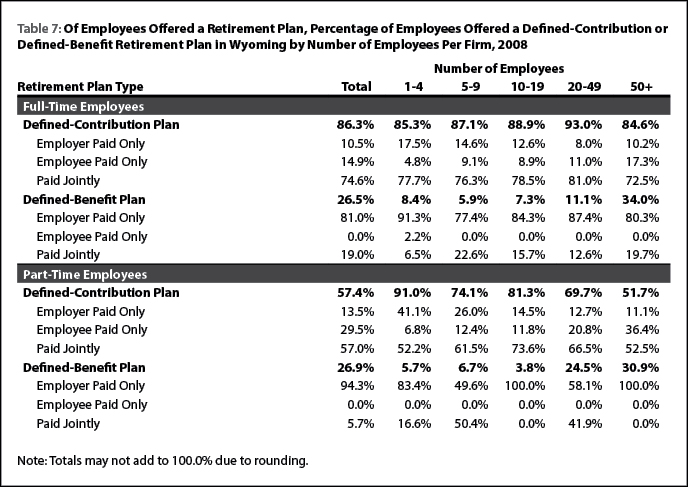 retirement plans than those in smaller firms (see Table
7).
Among full-time employees, 34.0% of those working for firms with 50 or
more workers were offered a defined-benefit retirement plan. Only 8.4%
of full-time workers employed by firms with 1-4 employees were offered
this benefit. Figure 9 shows that among all size classes,
retirement plans than those in smaller firms (see Table
7).
Among full-time employees, 34.0% of those working for firms with 50 or
more workers were offered a defined-benefit retirement plan. Only 8.4%
of full-time workers employed by firms with 1-4 employees were offered
this benefit. Figure 9 shows that among all size classes,  more than 90%
of employees were offered a defined-contribution retirement plan, and
it was offered to more than 80% of all employees.
more than 90%
of employees were offered a defined-contribution retirement plan, and
it was offered to more than 80% of all employees.
The average percentage of employees in the state that
chose to enroll in insurance and retirement plans is shown 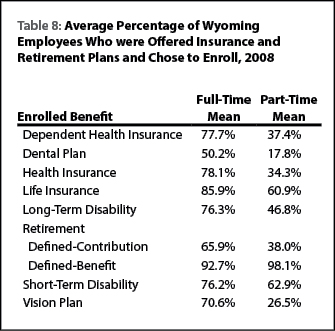 in Table
8.
More than three-fourths of employees (78.1%) chose to enroll in health
insurance and more than three-fourths (77.7%) chose to enroll their dependents.
A greater percentage of full-time employees enrolled in defined-benefit
plans (92.7%) than in defined-contribution
in Table
8.
More than three-fourths of employees (78.1%) chose to enroll in health
insurance and more than three-fourths (77.7%) chose to enroll their dependents.
A greater percentage of full-time employees enrolled in defined-benefit
plans (92.7%) than in defined-contribution 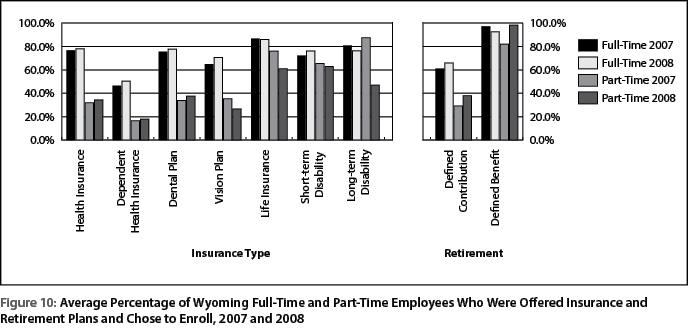 plans (65.9%). Employees are
often automatically enrolled in defined-benefit plans by their employers. Figure
10 shows that enrollment
rates between 2007 and 2008 for full-time employees increased for health
insurance, dental insurance, and for defined-contribution plans. However,
enrollment declined somewhat for defined-benefit plans.
plans (65.9%). Employees are
often automatically enrolled in defined-benefit plans by their employers. Figure
10 shows that enrollment
rates between 2007 and 2008 for full-time employees increased for health
insurance, dental insurance, and for defined-contribution plans. However,
enrollment declined somewhat for defined-benefit plans.
Part-time employees were most likely to enroll in defined-benefit retirement plans (98.1%), short-term disability insurance (62.9%), and life insurance (60.9%). Only 34.3% of part-time employees chose to enroll in health insurance and 37.4% enrolled in dependent health insurance. A greater proportion of part-time employees in 2008 enrolled in health insurance, dependent health insurance, dental insurance, defined-contribution plans, and defined-benefits plans than in 2007.
Table 9 shows how benefits are paid. Just over half
(55.4%) of health 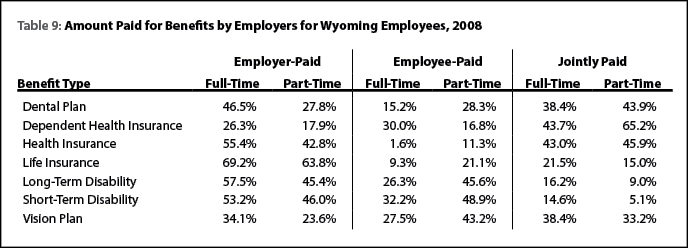 insurance premiums offered to full-time employees were
fully paid by employers, while dependent health insurance premiums were
more often paid jointly (43.7%). Employers paid fully for approximately
69.2% of life insurance premiums and 57.5% of long-term disability insurance
but only 34.1% of vision plans were employer-paid.
insurance premiums offered to full-time employees were
fully paid by employers, while dependent health insurance premiums were
more often paid jointly (43.7%). Employers paid fully for approximately
69.2% of life insurance premiums and 57.5% of long-term disability insurance
but only 34.1% of vision plans were employer-paid.
Full- and part-time employees received similar days
of paid holiday (7.1 days and 7.2 days, respectively, see Table
10).
When paid sick time was 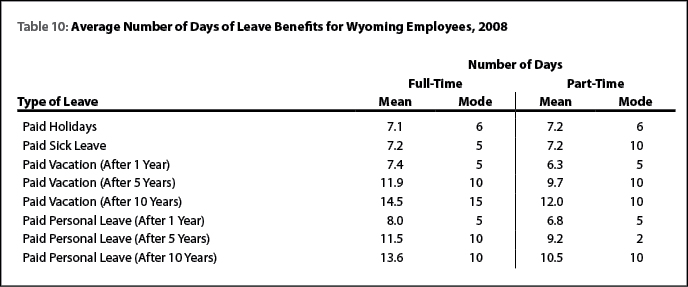 offered, both full-time and part-time employees
were offered an average of 7.2 days during 2008. After 10 years, full-time
employees were eligible for an average of 14.5 days of paid vacation
leave while part-time employees were eligible for an average of 12.0
days.
offered, both full-time and part-time employees
were offered an average of 7.2 days during 2008. After 10 years, full-time
employees were eligible for an average of 14.5 days of paid vacation
leave while part-time employees were eligible for an average of 12.0
days.