Can Wyoming Employment Be Modeled Accurately?
This article presents the results of projections for 2007 and 2008 and compares them to the sample-based estimates and the actual employment. It attempts to answer the questions of “How accurately can analysts model employment 12 months into the future?” and “Are these forecasts a useful tool for understanding sample-based estimates?”
Each month in Wyoming Labor Force Trends, employment estimates are published under the title “Wyoming Nonagricultural Wage and Salary Employment." These estimates come from a monthly survey of approximately 1,500 Wyoming employers known as the Current Employment Statistics (CES) program. CES estimates are an important economic indicator. Employment tends to rise when the economy is expanding and tends to decline when there is a recession. Additionally, wages and salaries are a large component of personal income, and when employment increases, analysts expect to see increases in wages, consumer spending, and local retail sales taxes.
One of the key problems in using current sample-based estimates is the lack of tools to answer the question “relative to what?” In order to remedy this situation, analysts at Research & Planning (R&P) have produced short-term employment projections. Comparing these projections to the sample-based estimates each month helps them to know whether or not the current sample-based estimates are reasonable given prior trends in employment. In other words, it gives analysts a tool to address the question of whether or not the underlying economic characteristics creating the demand for labor have deviated from the historic trend.In January 2007, R&P analysts ran projections of CES employment at the super-sector, or major industry level for each month of 2007. These projections represented their expectations of employment levels in 2007 based on historical data. Compared to 2006, analysts expected that total nonfarm employment would increase by approximately 6,900 jobs (2.5%).
During 2007, analysts conducted the CES survey and made estimates based on monthly reports from the sample of employers. In the figures, these sample-based estimates are labeled “production.”
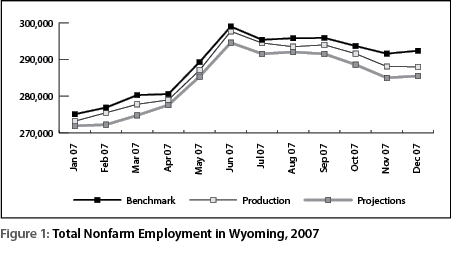
Figure 1 compares the projections for total nonagricultural employment developed in January 2007 to the sample-based production CES estimates as they were published during the subsequent year and the final benchmarked CES estimates as published in March 2009. To create the benchmarked estimates, analysts replace the original sample-based estimates with Quarterly Census of Employment and Wages (QCEW) data from the Unemployment Insurance (UI) tax file, which represent a virtual census of employment in the state. However, the QCEW data only become available approximately six months after the reference period. This six-month lag creates a considerable period of uncertainty about the accuracy of current sample-based estimates. Projections can help fill this knowledge gap. Figure 1 illustrates that the sample-based production CES estimates were higher every month than the projections. Moreover, the UI-based benchmarked series was even higher than the projections and the sample-based estimates. In short, employment grew faster than expected (based on historical trends) in 2007. At the total nonfarm employment level, the sample-based production CES estimates were valuable because they were closer to the actual employment levels than was the forecast. All three series followed the same seasonal pattern.
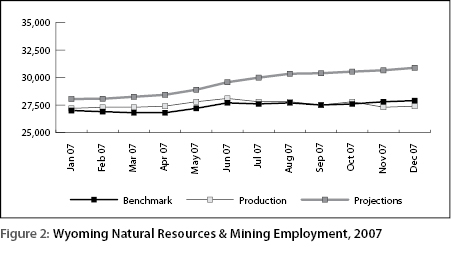
Figure 2 shows a different pattern. Actual employment in natural resources & mining (the benchmarked line) was much lower than the projections in every month of 2007. The benchmarked estimates were also lower than the sample-based production CES estimate for most of the 12-month period. It appears that analysts expected this sector to grow rapidly as it had in the three previous years (adding 1,900 jobs, 2,500 jobs, and 3,900 jobs in 2004, 2005, and 2006, respectively). Instead, it gained only 800 jobs (or 3.0%). Clearly, something changed from the historical trend in mining, and the sample-based estimates were picking it up. It is possible that new environmental regulations or a labor shortage caused employment growth to slow.
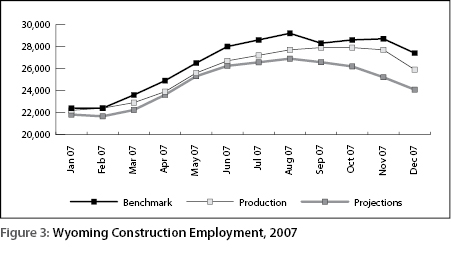
Construction employment can be difficult to estimate. Sometimes large employers come into the state for short-term projects, such as pipeline construction, causing large employment changes without historical precedent. It is almost impossible to account for employment at these nonresident firms in the sample-based production CES estimates. Figure 3 shows that the benchmarked estimates were higher than the projections every month of 2007. The production CES estimates failed to indicate the growth shown in the benchmarked series. Incidentally, in 2007, the construction sector added 2,700 jobs (11.3%), a rapid increase, but still slower than 2006 (3,200 jobs, or 15.5%). In July and August production estimates increased faster than the projections and it turned out more closely mirrored actual employment as measured by the UI tax universe. As with natural resources & mining, this sector was also changing direction from its historical trend.
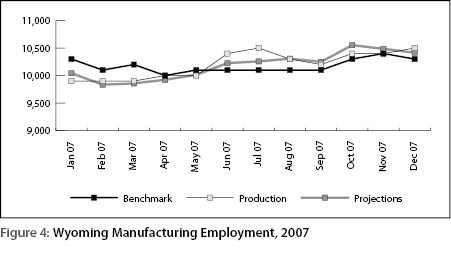
In the manufacturing sector (see Figure 4) the projections seem to be a fairly good indicator of actual employment for 2007. Although the series deviated somewhat over the months, the annual averages of all three series were remarkably close.
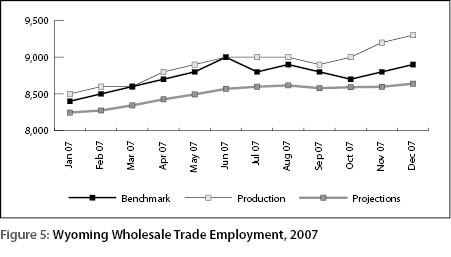
For the wholesale trade sector, the benchmarked series was fairly close to the sample-based production series during the first half of the year (see Figure 5). However, in the second half, the production estimates increased faster than the benchmarked series. The projections were lower than both the production estimates and the benchmarked series. It appears that the sample of employers (reflected in the production estimates) missed the employment decrease in October.
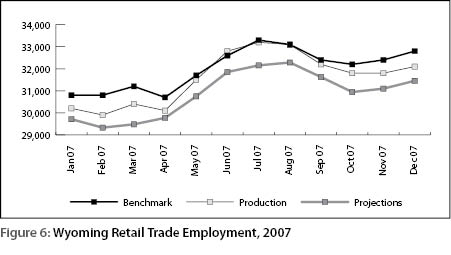
Figure 6 shows the retail trade sector. There is a clear seasonal pattern with employment starting at a low level in January and peaking in the summer months. Both the projections and the sample-based production estimates reflect this seasonal pattern, but the production estimates more accurately captured the growth seen in 2007. Retail Trade is another sector where growth was stronger than analysts initially expected.
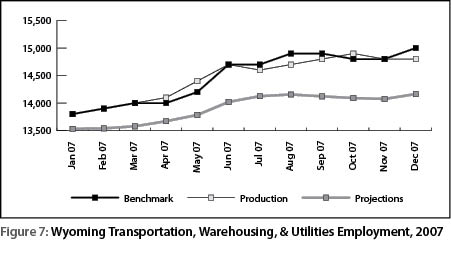
In transportation, warehousing, & utilities the sample-based production estimates were very close to the benchmarked series throughout the year (see Figure 7). However, the projections were much lower than the other series and were not a good predictor of actual employment.
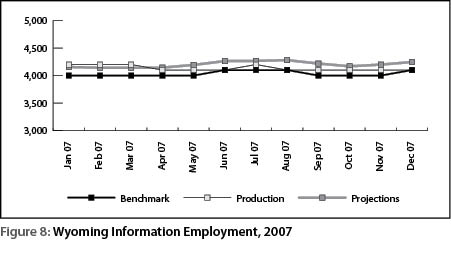
The information sector is shown in Figure 8. This is a stable industry with little seasonal variation. The projections and the sample-based production CES series tended to over-estimate relative to the benchmarked series, but overall, the differences were small.
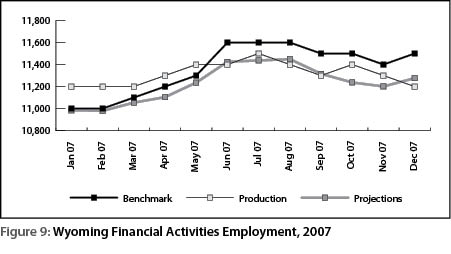
Figure 9 shows that there is a seasonal pattern to employment in financial activities. This industry has been growing fairly steadily in recent years, and the projections appear to be a reasonable approximation of actual employment.
Figure 10 illustrates employment in the professional & business services sector. It appears that analysts noticed the consistent gap between the sample-based estimates and the benchmarked series in the first several months of the year so the CES estimates were adjusted upward in the last few months of the year. As a result, from August to December, the sample-based production CES estimates were very close to the benchmarked series. This was a case where information from outside the CES sample was used by analysts in making production CES estimates.
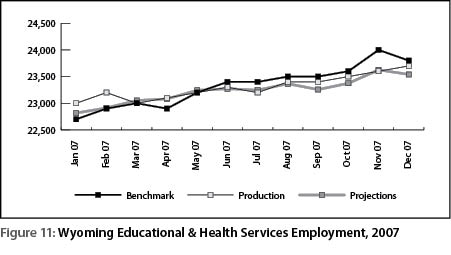
In Figure 11, educational & health services, the production CES series and the projections were close throughout the year. The sample-based production series did not seem to accurately capture the growth in the second half of the year. However, some of the positive errors were cancelled out by negative errors and the annual averages of the production and benchmarked series were similar.
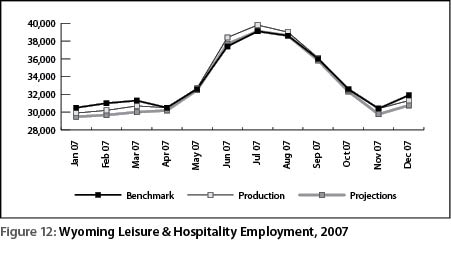
Leisure & Hospitality has a stable seasonal pattern (see Figure 12) with employment peaking in July. The sample-based production series underestimated employment in the first quarter of the year and overestimated in June, July, and August. This may be a case where analyst intervention made the production estimates less accurate. The annual averages of the production and benchmark series were very close to each other and marginally higher than the projections.
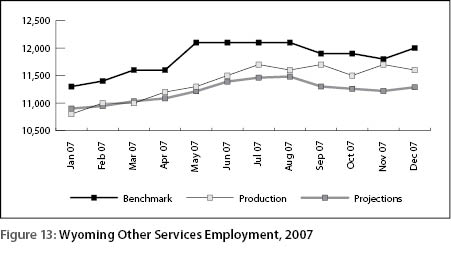
Figure 13 shows that neither the projections nor the sample-based production estimates accurately predicted the benchmarked employment for other services. However, by December, the production estimates reflected some of the growth in this sector.
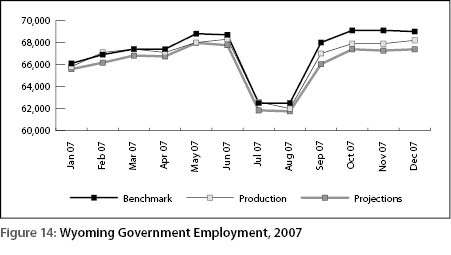
Government employment, as shown in Figure 14, has a definite seasonal pattern. The sample-based production CES estimates captured more of the growth than did the projections. On an annual average basis, the CES estimates were approximately 500 jobs lower than the benchmarked series, and the projections underestimated growth by more than 1,000 jobs.
In January 2008, analysts again developed annual projections. Their expectations were for annual growth of approximately 5,700 jobs (2.0%). It should be noted that the 2008 benchmarked series reflects replacement with QCEW data through September. At the time the benchmark is done, fourth quarter QCEW data are not available, so the final three months of benchmarked 2008 data are sample-based estimates using September as a starting point.
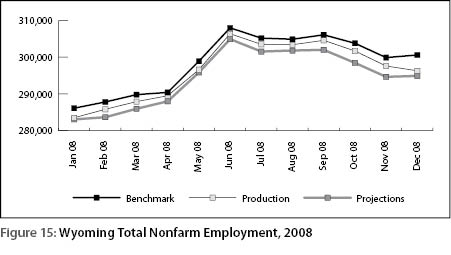
Figure 15 looks similar to Figure 1. In both 2007 and 2008, the sample-based production estimates for total nonfarm employment were higher than the projections and both were lower than the benchmarked series.
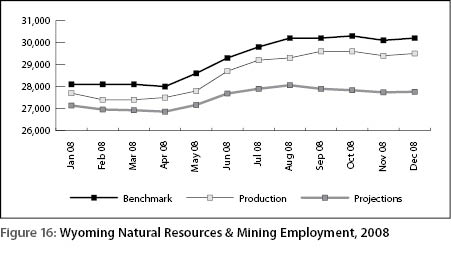
Actual employment in natural resources & mining (the benchmarked line) was higher than projections and higher than the sample-based production series (see Figure 16). At least part of this situation can be explained by the large run-up in energy prices during the summer of 2008. It appears that analysts expected much slower growth (similar to what actually happened in 2007).
In Figure 17, the production estimates for construction started out fairly close to the projections line, but increased rapidly in May and June. In each month the benchmarked series is higher than the projections, again suggesting that growth in construction was stronger than originally thought.
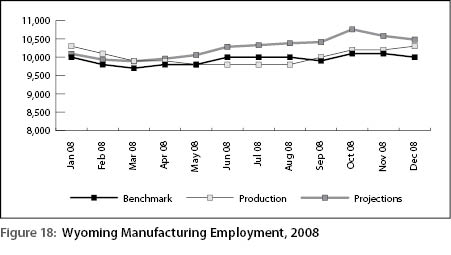
In the manufacturing sector for most of the year, employment was less than projected (see Figure 18). On an annual average basis, the projections were approximately 300 jobs higher than the benchmarked series.
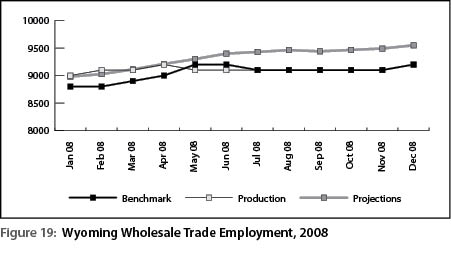
Figure 19 shows that in wholesale trade, the sample-based production estimates were practically the same as the benchmarked estimates for much of the year. The projections, however, were noticeably higher than the benchmarked series from May to December.
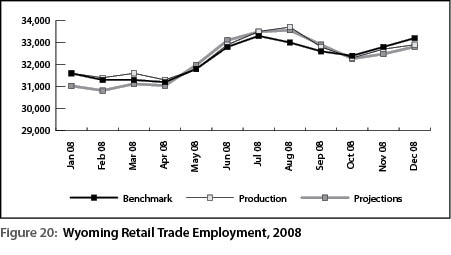
For the retail trade sector (see Figure 20), the projections appear to predict monthly employment reasonably accurately. However, the annual averages of all three series are very similar.
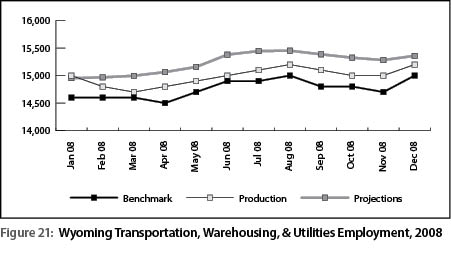
Projections of 2008 employment in transportation, warehousing & utilities were unreasonably high (see Figure 21). Employment in this sector had grown rapidly in recent years, adding 900 jobs in 2006 and 1,000 jobs in 2007. Analysts expected this fast paced growth to continue. The annual average of the projections series was approximately 500 jobs higher than the benchmarked series.
Figure 22 is similar to Figure 8. In both 2007 and 2008, employment in the information sector was stable and similar to projections.
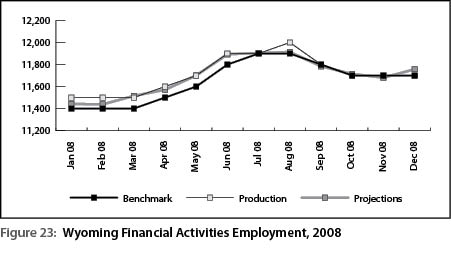
All three series were similar in financial activities (see Figure 23). Both the projections and the sample-based production estimates were good predictors of actual (or benchmarked) employment.
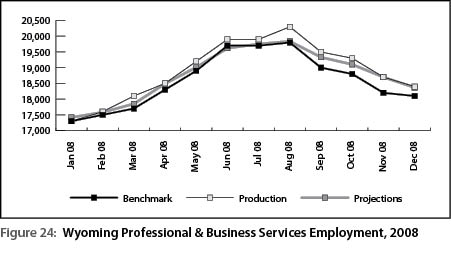
For employment in professional & business services (see Figure 24), the actual employment, or the benchmarked series, is lower than the projections and the sample-based production estimates in almost every month. In this sector, it appears that the projections were a better predictor of actual employment than the production estimates. Particularly from June to October, the production estimates were noticeably higher than the benchmarked series.
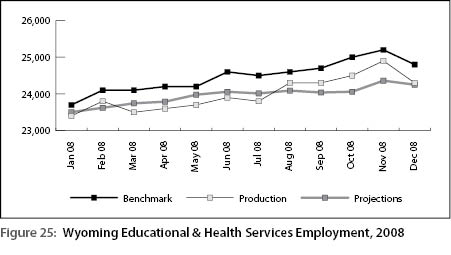
In the educational & health services sector, the benchmarked employment series was much higher than the projections and the sample-based production series (see Figure 25). In other words, job growth was faster than expected.
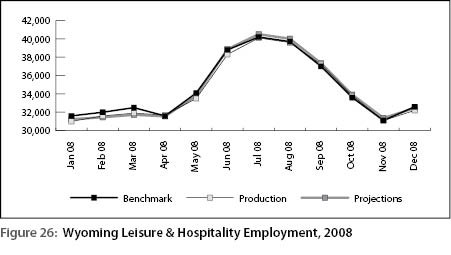
The projections for leisure & hospitality seemed to accurately predict employment for most of the year (see Figure 26). From January to March 2008, however, actual employment (the benchmarked series) was much higher than either the sample-based production series or the projections.
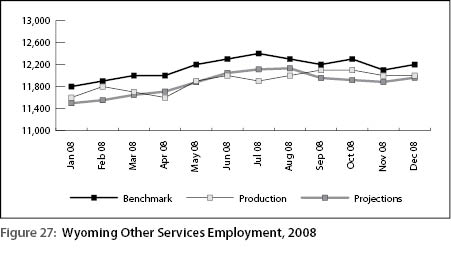
In the other services sector, the annual averages for both the projections and sample-based production series were practically the same (see Figure 27). The benchmarked series was much higher, suggesting that growth was again stronger than expected.
Government employment had a similar pattern in 2007 and 2008 (see Figure 28). For practically the whole year, sample-based production estimates were higher than projections and both were lower than the actual benchmarked series. Growth was much stronger than expected, but the production CES estimates did capture much of the increase.In general, the figures illustrate the fact that although projections might accurately predict the seasonal pattern in total nonfarm employment and in many sectors, they are inferior to the sample-based production CES estimates made throughout the year. There are at least two reasons why production estimates are better. First, they are based on actual data reported by a sample of employers. In other words, the data employers in the sample report each month is a valuable indicator of overall employment trends. In Figures 1, 7, 14, 15, and 28, the production estimates seem more accurate than the projections.
Second, as the year progresses and analysts receive QCEW data, they are able to incorporate this information into their production estimates. This is particularly seen in the construction sector in 2007 (see Figure 3), professional & business services in 2007 (see Figure 10), and natural resources & mining in 2008 (see Figure 16).
Another important lesson from this exercise is that the ability of projections to accurately predict employment depends on the state of the economy. If the economy is growing at a steady rate over a few years, it is much more likely that time-series methods will produce accurate projections. Time-series methods are not able to accurately predict turning points, or inflection points in economic time series. This can be seen in natural resources & mining in 2007 (see Figure 2) as the projections indicated strong growth that didn’t actually happen. In the future, analysts could use causal models to more accurately predict employment levels. In summary, most of the projections accurately reflected the seasonal patterns of the sectors, but their ability to predict growth or decline was mixed. There are many reasons why employment levels can deviate from historical trends; however, the projections are a useful tool for evaluating the sample-based estimates.