Economic Indicators
Laramie County nonfarm employment increased by 1.6% from March 2010 to March 2011.
| Mar | Feb | Mar | Percent Change | |||||
| 2011 | 2011 | 2010 | Month | Year | ||||
| ______(p)_ | ______(r)_ | _____(b)_ | _____ | _____ | ||||
| Wyoming Total Nonfarm Employment | 277,300 | 275,100 | 274,400 | 0.8 | 1.1 | |||
| Wyoming State Government | 17,200 | 17,000 | 16,800 | 1.2 | 2.4 | |||
| Laramie County Nonfarm Employment | 43,400 | 43,100 | 42,700 | 0.7 | 1.6 | |||
| Natrona County Nonfarm Employment | 38,200 | 37,800 | 37,900 | 1.1 | 0.8 | |||
| Selected U.S. Employment Data | ||||||||
| U.S. Multiple Jobholders | 6,882,000 |
6,621,000 |
7,161,000 |
3.9 |
-3.9 |
|||
| As a percent of all workers | 5.0% |
4.8% |
5.2% |
N/A |
N/A |
|||
| U.S. Discouraged Workers | 1,020,000 |
993,000 |
1,204,000 |
2.7 |
-15.3 |
|||
| U.S. Part Time for Economic Reasons | 8,749,000 |
9,187,000 |
9,282,000 |
-4.8 |
-5.7 |
|||
| Wyoming Unemployment Insurance | ||||||||
| Weeks Compensated | 33,421 |
32,494 |
44,526 |
2.9 |
-24.9 |
|||
| Benefits Paid | $10,682,167 |
$10,395,251 |
$14,975,761 |
2.8 |
-28.7 |
|||
| Average Weekly Benefit Payment | $319.62 |
$319.91 |
$336.34 |
-0.1 |
-5.0 |
|||
| State Insured Covered Jobs1 | 251,656 |
251,620 |
249,068 |
0.0 |
1.0 |
|||
| Insured Unemployment Rate | 3.4% |
3.4% |
4.7% |
N/A |
N/A |
|||
| Consumer Price Index (U) for All U.S. Urban Consumers | ||||||||
| (1982 to 1984 = 100) | ||||||||
| All Items | 221.3 | 220.2 | 216.7 | 0.5 | 2.1 | |||
| Food & Beverages | 224.0 | 223.2 | 219.1 | 0.4 | 2.2 | |||
| Housing | 217.3 | 216.7 | 215.8 | 0.2 | 0.7 | |||
| Apparel | 118.4 | 116.7 | 118.9 | 1.5 | -0.4 | |||
| Transportation | 203.0 | 200.8 | 189.6 | 1.1 | 7.1 | |||
| Medical Care | 397.1 | 393.9 | 385.9 | 0.8 | 2.9 | |||
| Recreation (Dec. 1997=100) | 113.2 | 112.6 | 113.3 | 0.5 | -0.1 | |||
| Education & Communication (Dec. 1997=100) | 130.7 | 130.7 | 129.1 | 0.0 | 1.2 | |||
| Other Goods & Services | 385.4 | 384.7 | 378.0 | 0.2 | 2.0 | |||
| Producer Prices (1982 to 1984 = 100) | ||||||||
| All Commodities | 195.5 | 192.2 | 181.0 | 1.7 | 8.0 | |||
| Wyoming Building Permits (New Privately Owned Housing Units Authorized) | ||||||||
| Total Units | 75 | 84 | 387 | -10.7 | -80.6 | |||
| Valuation | $13,045,000 | $14,646,000 | $37,408,000 | -10.9 | -65.1 | |||
| Single Family Homes | 50 | 64 | 69 | -21.9 | -27.5 | |||
| Valuation | $11,125,000 | $12,940,000 | $13,174,000 | -14.0 | -15.6 | |||
| Casper MSA2 Building Permits | 12 | 9 | 328 | 33.3 | -96.3 | |||
| Valuation | $1,281,000 | $1,349,000 | $25,383,000 | -5.0 | -95.0 | |||
| Cheyenne MSA2 Building Permits | 25 | 24 | 27 | 4.2 | -7.4 | |||
| Valuation | $2,934,000 | $2,938,000 | $3,439,000 | -0.1 | -14.7 | |||
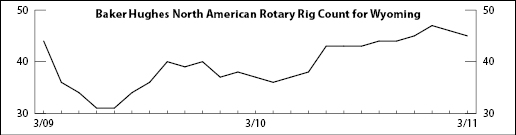
| Baker Hughes North American Rotary Rig Count for Wyoming | 46 | 47 | 38 | -2.1 | 21.1 | |||
| (p) Preliminary. (r) Revised. (b) Benchmarked. 1 Local Area Unemployment Statistics Program estimates. |
||||||||
| 2 Metropolitan Statistical Area. | ||||||||
| Note: Production worker hours and earnings data have been dropped from the Economic Indicators page because of problems with accuracy due to a small sample size and high item nonresponse. The Bureau of Labor Statistics will continue to publish these data online at http://www.bls.gov/eag/eag.wy.htm | ||||||||