Wyoming Normalizeda Unemployment Insurance Statistics: Continued Claims
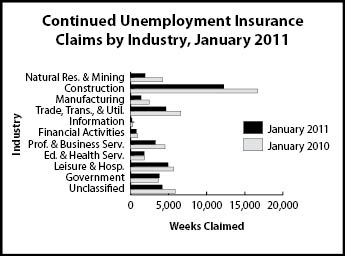
Continued weeks claimed increased 11.3% compared to December 2010 while declining 26.4% compared to January 2010. Claims in goods-producing industries were sharply lower (-33.6%) than a year ago.
| Percent Change Weeks Claimed | |||||
| Continued Weeks Claimed | Jan_11 | Jan_11 | |||
| Jan_11 | Dec_10 | Jan_10 | Dec_10 | Jan_10 | |
| Wyoming Statewide | |||||
| Total Weeks Claimed | 39,670 | 35,654 | 53,923 | 11.3 | -26.4 |
| Extended Weeks Claimed | 19,006 | 18,852 | 26,316 | 0.8 | -27.8 |
| Total Unique Claimants* | 11,680 | 8,903 | 15,314 | 31.2 | -23.7 |
| Benefit Exhaustions | 902 | 737 | 1,357 | 22.4 | -33.5 |
| Benefit Exhaustion Rates | 7.7% | 8.3% | 8.9% | -0.6% | -1.1% |
| Goods-Producing | 15,517 | 11,390 | 23,354 | 36.2 | -33.6 |
| Natural Resources & Mining | 1,899 | 1,582 | 4,212 | 20.0 | -54.9 |
| Mining | 1,614 | 1,328 | 3,821 | 21.5 | -57.8 |
| Oil & Gas Extraction | 147 | 103 | 251 | 42.7 | -41.4 |
| Construction | 12,246 | 8,953 | 16,680 | 36.8 | -26.6 |
| Manufacturing | 1,372 | 855 | 2,462 | 60.5 | -44.3 |
| Service-Providing | 16,214 | 16,830 | 21,055 | -3.7 | -23.0 |
| Trade, Transp., & Utilities | 4,646 | 4,391 | 6,580 | 5.8 | -29.4 |
| Wholesale Trade | 611 | 558 | 1,073 | 9.5 | -43.1 |
| Retail Trade | 3,006 | 2,827 | 3,878 | 6.3 | -22.5 |
| Transp., Wareh., & Utilities | 1,029 | 1,006 | 1,629 | 2.3 | -36.8 |
| Information | 175 | 168 | 278 | 4.2 | -37.1 |
| Financial Activities | 763 | 792 | 911 | -3.7 | -16.2 |
| Prof. & Business Services | 3,259 | 2,793 | 4,531 | 16.7 | -28.1 |
| Educational & Health Services | 1,786 | 1,709 | 1,821 | 4.5 | -1.9 |
| Leisure & Hospitality | 4,919 | 6,305 | 5,640 | -22.0 | -12.8 |
| Other Svcs., ex. Public Admin. | 666 | 672 | 1,294 | -0.9 | -48.5 |
| Government | 3,788 | 3,909 | 3,666 | -3.1 | 3.3 |
| Federal Government | 2,083 | 2,229 | 1,621 | -6.6 | 28.5 |
| State Government | 250 | 258 | 407 | -3.1 | -38.6 |
| Local Government | 1,455 | 1,422 | 1,638 | 2.3 | -11.2 |
| Local Education | 337 | 336 | 380 | 0.3 | -11.3 |
| Unclassified | 4,151 | 3,525 | 5,848 | 17.8 | -29.0 |
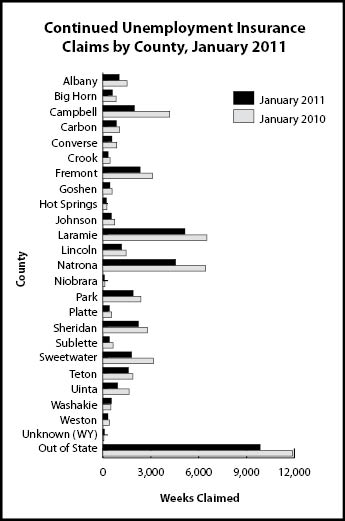
| Laramie County | |||||
| Total Weeks Claimed | 5,131 | 4,496 | 6,514 | 14.1 | -21.2 |
| Total Unique Claimants | 1,565 | 1,136 | 1,860 | 37.8 | -15.9 |
| Goods-Producing | 2,187 | 1,655 | 2,895 | 32.1 | -24.5 |
| Construction | 1,890 | 1,499 | 2,405 | 26.1 | -21.4 |
| Service-Providing | 2,238 | 2,113 | 3,054 | 5.9 | -26.7 |
| Trade, Transp., & Utilities | 680 | 611 | 1,015 | 11.3 | -33.0 |
| Financial Activities | 137 | 149 | 192 | -8.1 | -28.6 |
| Prof. & Business Services | 558 | 497 | 855 | 12.3 | -34.7 |
| Educational & Health Svcs. | 439 | 426 | 327 | 3.1 | 34.3 |
| Leisure and Hospitality | 309 | 293 | 491 | 5.5 | -37.1 |
| Government | 544 | 569 | 402 | -4.4 | 35.3 |
| Unclassified | 162 | 159 | 163 | 1.9 | -0.6 |
| Natrona County | |||||
| Total Weeks Claimed | 4,557 | 3,887 | 6,437 | 17.2 | -29.2 |
| Total Unique Claimants | 1,336 | 953 | 1,836 | 40.2 | -27.2 |
| Goods-Producing | 1,726 | 1,154 | 2,962 | 49.6 | -41.7 |
| Construction | 1,271 | 830 | 2,048 | 53.1 | -37.9 |
| Service-Providing | 2,475 | 2,386 | 3,072 | 3.7 | -19.4 |
| Trade, Transp., & Utilities | 1,065 | 1,004 | 1,031 | 6.1 | 3.3 |
| Financial Activities | 100 | 107 | 101 | -6.5 | -1.0 |
| Professional & Business Svcs. | 428 | 401 | 555 | 6.7 | -22.9 |
| Educational & Health Services | 321 | 326 | 404 | -1.5 | -20.5 |
| Leisure & Hospitality | 391 | 392 | 517 | -0.3 | -24.4 |
| Government | 280 | 285 | 266 | -1.8 | 5.3 |
| Unclassified | 76 | 62 | 137 | 22.6 | -44.5 |
| *Does not include claimants receiving extended benefits | |||||