
Economic Indicators
Regular unemployment insurance benefits paid in Wyoming fell by 26.6% from September 2010 to September 2011.
|
Sep
2011 (p) |
Aug
2011 (r) |
Sep
2010 (b) |
Percent Change | ||||
|---|---|---|---|---|---|---|---|
| Month | Year | ||||||
| Wyoming Total Nonfarm Employment | 299,500 | 297,500 | 290,900 | 0.7 | 3.0 | ||
| Wyoming State Government | 17,600 | 16,300 | 17,300 | 8.0 | 1.7 | ||
| Laramie County Nonfarm Employment | 44,300 | 44,400 | 43,800 | -0.2 | 1.1 | ||
| Natrona County Nonfarm Employment | 40,500 | 39,600 | 38,500 | 2.3 | 5.2 | ||
| Selected U.S. Employment Data | |||||||
| U.S. Multiple Jobholders | 6,946,000 | 6,649,000 | 6,681,000 | 4.5 | 4.0 | ||
| As a percent of all workers | 4.9% | 4.7% | 4.8% | N/A | N/A | ||
| U.S. Discouraged Workers | 1,037,000 | 977,000 | 1,209,000 | 6.1 | -14.2 | ||
| U.S. Part Time for Economic Reasons | 8,541,000 | 8,604,000 | 8,628,000 | -0.7 | -1.0 | ||
| Wyoming Unemployment Insurance | |||||||
| Weeks Compensated | 13,566 | 18,283 | 18,524 | -25.8 | -26.8 | ||
| Benefits Paid | $4,482,114 | $5,978,200 | $6,103,667 | -25.0 | -26.6 | ||
| Average Weekly Benefit Payment | $330.39 | $326.98 | $329.50 | 1.0 | 0.3 | ||
| State Insured Covered Jobs1 | 266,356 | 265,309 | 266,357 | 0.4 | 0.0 | ||
| Insured Unemployment Rate | 1.9% | 1.7% | 2.0% | N/A | N/A | ||
| Consumer Price Index (U) for All U.S. Urban Consumers | |||||||
| (1982 to 1984 = 100) | |||||||
| All Items | 226.9 | 226.5 | 218.4 | 0.2 | 3.9 | ||
| Food & Beverages | 230.4 | 229.5 | 220.6 | 0.4 | 4.5 | ||
| Housing | 220.5 | 220.5 | 216.6 | 0.0 | 1.8 | ||
| Apparel | 125.3 | 121.5 | 121.0 | 3.1 | 3.5 | ||
| Transportation | 215.2 | 216.1 | 192.4 | -0.4 | 11.8 | ||
| Medical Care | 401.6 | 400.9 | 390.6 | 0.2 | 2.8 | ||
| Recreation (Dec. 1997=100) | 113.4 | 113.6 | 113.1 | -0.1 | 0.3 | ||
| Education & Communication (Dec. 1997=100) | 132.6 | 132.0 | 131.2 | 0.5 | 1.1 | ||
| Other Goods & Services | 388.6 | 387.1 | 383.7 | 0.4 | 1.3 | ||
| Producer Prices (1982 to 1984 = 100) | |||||||
| All Commodities | 204.0 | 203.2 | 184.9 | 0.4 | 10.4 | ||
| Wyo. Bldg. Permits (New Privately Owned Housing Units Authorized) | |||||||
| Total Units | 184 | 216 | 134 | -14.8 | 37.3 | ||
| Valuation | $34,598,000 | $32,954,000 | $27,028,000 | 5.0 | 28.0 | ||
| Single Family Homes | 122 | 119 | 106 | 2.5 | 15.1 | ||
| Valuation | $30,739,000 | $25,964,000 | $24,694,000 | 18.4 | 24.5 | ||
| Casper MSA2 Building Permits | 69 | 98 | 16 | -29.6 | 331.3 | ||
| Valuation | $6,082,000 | $8,288,000 | $2,533,000 | -26.6 | 140.1 | ||
| Cheyenne MSA Building Permits | 33 | 21 | 36 | 57.1 | -8.3 | ||
| Valuation | $5,629,000 | $3,482,000 | $4,105,000 | 61.7 | 37.1 | ||
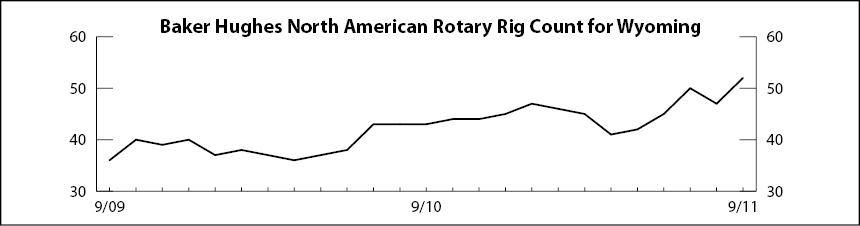
| Baker Hughes North American Rotary Rig Count for Wyoming | 52 | 47 | 43 | 10.6 | 20.9 | ||
|
|||||||
| (p) Preliminary. (r) Revised. (b) Benchmarked. | |||||||
| 1Local Area Unemployment Statistics Program estimates. | |||||||
| 2Metropolitan Statistical Area. | |||||||
| Note: Production worker hours and earnings data have been dropped from the Economic Indicators page because of problems with accuracy due to a small sample size and high item nonresponse. The Bureau of Labor Statistics will continue to publish these data online at http://www.bls.gov/eag/eag.wy.htm | |||||||