Wyoming Normalized Unemployment Insurance Statistics: Initial Claims
by: Douglas W. Leonard, Senior Economist
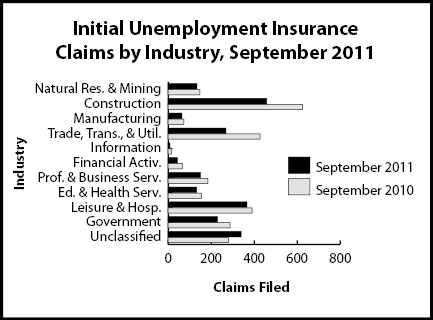
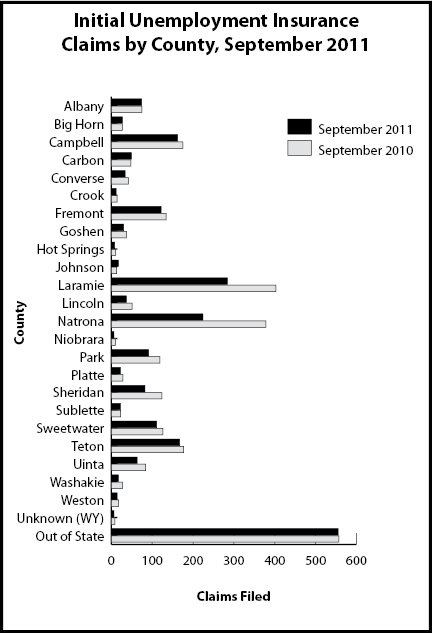
Initial claims were 17.4% less than in September 2010. However, claims increased slightly over the year in state (10.3%) and local government (5.9%).
|
Initial Claims
|
Claims Filed
|
Percent Change Claims Filed
|
|
Sep 11
|
Sep 11
|
|
Sep 11
|
Aug 11
|
Sep 10
|
Aug 11
|
Sep 10
|
|
Wyoming Statewide
|
|
TOTAL CLAIMS FILED
|
2,236
|
1,945
|
2,707
|
15.0
|
-17.4
|
|
TOTAL GOODS-PRODUCING
|
656
|
556
|
845
|
18.0
|
-22.4
|
|
Natural Res. & Mining
|
134
|
147
|
148
|
-8.8
|
-9.5
|
|
Mining
|
130
|
132
|
140
|
-1.5
|
-7.1
|
|
Oil & Gas Extraction
|
16
|
12
|
16
|
33.3
|
0.0
|
|
Construction
|
458
|
360
|
624
|
27.2
|
-26.6
|
|
Manufacturing
|
64
|
49
|
73
|
30.6
|
-12.3
|
|
TOTAL SERVICE-PROVIDING
|
1,012
|
904
|
1,294
|
11.9
|
-21.8
|
|
Trade, Transp., & Utilities
|
268
|
308
|
428
|
-13.0
|
-37.4
|
|
Wholesale Trade
|
35
|
50
|
108
|
-30.0
|
-67.6
|
|
Retail Trade
|
187
|
184
|
239
|
1.6
|
-21.8
|
|
Transp., Warehousing & Utilities
|
46
|
74
|
81
|
-37.8
|
-43.2
|
|
Information
|
8
|
8
|
16
|
0.0
|
-50.0
|
|
Financial Activities
|
43
|
58
|
66
|
-25.9
|
-34.8
|
|
Prof. and Business Svcs.
|
150
|
147
|
185
|
2.0
|
-18.9
|
|
Educational & Health Svcs.
|
132
|
143
|
154
|
-7.7
|
-14.3
|
|
Leisure & Hospitality
|
366
|
191
|
390
|
91.6
|
-6.2
|
|
Other Svcs., exc. Public Admin.
|
45
|
49
|
55
|
-8.2
|
-18.2
|
|
TOTAL GOVERNMENT
|
229
|
162
|
288
|
41.4
|
-20.5
|
|
Federal Government
|
90
|
47
|
158
|
91.5
|
-43.0
|
|
State Government
|
32
|
22
|
29
|
45.5
|
10.3
|
|
Local Government
|
107
|
93
|
101
|
15.1
|
5.9
|
|
Local Education
|
26
|
29
|
27
|
-10.3
|
-3.7
|
|
UNCLASSIFIED
|
339
|
323
|
280
|
5.0
|
21.1
|
|
Laramie County
|
|
TOTAL CLAIMS FILED
|
281
|
282
|
403
|
-0.4
|
-30.3
|
|
TOTAL GOODS-PRODUCING
|
95
|
76
|
144
|
25.0
|
-34.0
|
|
Construction
|
81
|
58
|
120
|
39.7
|
-32.5
|
|
TOTAL SERVICE-PROVIDING
|
128
|
160
|
178
|
-20.0
|
-28.1
|
|
Trade, Transp., & Utilities
|
34
|
47
|
62
|
-27.7
|
-45.2
|
|
Financial Activities
|
6
|
12
|
7
|
-50.0
|
-14.3
|
|
Prof. & Business Svcs.
|
28
|
33
|
33
|
-15.2
|
-15.2
|
|
Educational & Health Svcs.
|
23
|
29
|
32
|
-20.7
|
-28.1
|
|
Leisure & Hospitality
|
27
|
30
|
32
|
-10.0
|
-15.6
|
|
TOTAL GOVERNMENT
|
40
|
28
|
65
|
42.9
|
-38.5
|
|
UNCLASSIFIED
|
18
|
18
|
16
|
0.0
|
12.5
|
|
Natrona County
|
|
TOTAL CLAIMS FILED
|
224
|
264
|
377
|
-15.2
|
-40.6
|
|
TOTAL GOODS-PRODUCING
|
83
|
78
|
121
|
6.4
|
-31.4
|
|
Construction
|
61
|
47
|
78
|
29.8
|
-21.8
|
|
TOTAL SERVICE-PROVIDING
|
117
|
167
|
225
|
-29.9
|
-48.0
|
|
Trade, Transp., & Utilities
|
42
|
64
|
115
|
-34.4
|
-63.5
|
|
Financial Activities
|
7
|
11
|
9
|
-36.4
|
-22.2
|
|
Prof. & Business Svcs.
|
18
|
23
|
25
|
-21.7
|
-28.0
|
|
Educational & Health Svcs.
|
18
|
30
|
24
|
-40.0
|
-25.0
|
|
Leisure & Hospitality
|
19
|
23
|
38
|
-17.4
|
-50.0
|
|
TOTAL GOVERNMENT
|
15
|
13
|
26
|
15.4
|
-42.3
|
|
UNCLASSIFIED
|
9
|
6
|
5
|
50.0
|
80.0
|


Last modified
by Phil Ellsworth.


