
Local Jobs and Payroll in Wyoming: Construction Sector Adds Jobs in 2012Q1
See Related Tables and Figures
Despite recent growth, overall employment in Wyoming remains approximately 6,200 jobs (-2.2%) below its first quarter 2008 level. In other words, the state has yet to recoup all the job losses of 2009 and 2010.
|
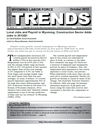
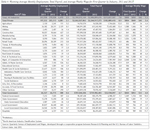
Total unemployment insurance (UI) covered payroll increased by $215.8 million (7.8%) in first quarter 2012 (2012Q1) compared to 2011Q1. Employment rose by 6,470 jobs (2.5%) and the average weekly wage increased by $42 (5.2%). Job growth in first quarter was higher than its five-year average (2.5% compared to 0.3%; see Table 1). Total wages and average weekly wage also grew faster than their five-year averages. In terms of dollars, UI covered payroll represents approximately 91% of all wage and salary disbursements and 43% of personal income in the state (U.S. Bureau of Economic Analysis, 2011). Analysts have noted that "minerals related employment is one of the key predictors of sales and use tax revenue" in Wyoming (CREG, 2010).
The covered payroll and employment data in this article are tabulated by place of work, in contrast to the labor force estimates which are a measure of employed and unemployed persons by place of residence. Also, the employment data presented in this article represent a count of jobs, not persons. When individuals work more than one job, each job is counted separately. Finally, job growth (or decline) is stated in terms of net change. The Quarterly Turnover Statistics by Industry table presents alternative measures of job gains and losses using the same data sources and calculated to describe the components of change.
|
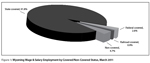
Figure 1 shows Wyoming wage & salary employment by covered/non-covered status. Approximately 92% of wage & salary jobs in the state are covered by state unemployment insurance, while 2.6% of jobs are covered by federal unemployment insurance, and 0.9% are covered by unemployment insurance administered by the railroad retirement board. There are several categories of non-covered jobs, and together they account for approximately 5% of wage & salary jobs in the state. Some examples of non-covered employment include elected officials, students working at educational institutions, employees of churches, and workers at small nonprofit organizations.
The purpose of this article is to illustrate and describe employment and payroll changes between first quarter 2011 and first quarter 2012. These economic changes help gauge the overall strength of Wyoming's economy and identify the fastest and slowest growing sectors and geographic areas.
 |
 |
 |
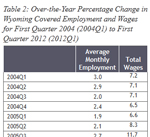
Job growth accelerated from 2.0% in fourth quarter to 2.5% in first quarter (see Table 2). Figure 2 shows that total payroll growth rebounded sharply from 2.5% in fourth quarter to 7.8% in first quarter.
Employment and Wages by County
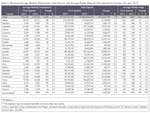
Employment increased in 19 counties and decreased in four counties (see Table 3). Total payroll rose in 22 counties and fell in one county.
Sweetwater County added 693 jobs (2.9%) and its total payroll rose by $35.4 million (11.3%). Large job gains were seen in mining (including oil & gas; approximately 600 jobs) and accommodation & food services (more than 100 jobs).
Campbell County gained 653 jobs (2.4%) and its total payroll increased by $19.4 million (5.1%). Employment increased substantially in mining (including oil & gas; more than 350 jobs), local government (including public schools, colleges & hospitals, more than 100 jobs), and wholesale trade (approximately 100 jobs).
Employment increased by 465 jobs (8.7%) in Sublette County and its total payroll rose by $8.2 million (9.9%). Construction posted the largest job gains (more than 250 jobs). Growth was also seen in mining (including oil & gas), real estate & rental & leasing, professional & technical services, and administrative & waste services.
Park County added 455 jobs (3.7%) and its total payroll grew by $11.1 million (10.1%). Notable job gains were seen in accommodation & food services (nearly 150 jobs), mining (including oil & gas; approximately 100 jobs), construction (more than 50 jobs), and local government (including public schools, colleges, & hospitals; more than 50 jobs).
Teton County gained 404 jobs (2.6%) and its total payroll rose by $2.9 million (1.9%). Construction added more than 150 jobs; arts, entertainment, & recreation added approximately 50 jobs, and accommodation & food services added approximately 50 jobs. Smaller job gains were seen in health care & social assistance, local government, and transportation & warehousing.
Converse County employment grew by 401 jobs (7.6%) and its total payroll increased by $5.5 million (9.9%). Sizeable job gains occurred in accommodation & food services (nearly 100 jobs), mining (including oil & gas; more than 50 jobs), manufacturing (more than 50 jobs), and construction (more than 50 jobs).
Uinta County added 289 jobs (3.3%) and its total payroll rose by $6.9 million (7.9%). Modest job gains were seen in construction, mining (including oil & gas), administrative & waste services, manufacturing, and local government.
Lincoln County lost 201 jobs (-3.4%) and its total payroll fell by $4.6 million (-7.5%). Job losses were seen in construction, wholesale trade, and manufacturing.
Employment in Washakie County fell by 92 jobs (-2.4%), but its total payroll increased by $1.0 million (3.0%). Modest job losses occurred in manufacturing, finance & insurance, and professional & technical services.
Platte County's employment decreased by 77 jobs (-2.2%), but its total payroll increased by $0.7 million (2.2%). Job losses were seen in local government, accommodation & food services, and state government.
|
|
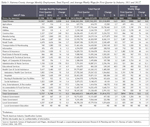
Natrona County added 2,049 jobs (5.4%) and its total payroll increased by $53.3 million (12.9%). Large job gains were seen in mining (including oil & gas; 342 jobs, or 9.7%), wholesale trade (283 jobs, or 11.8%), accommodation & food services (253 jobs, or 7.4%), construction (240 jobs, or 10.3%), and manufacturing (203 jobs, or 12.3%). Employment fell in health care & social assistance (-137 jobs, or -2.4%), federal government (-20 jobs, or -2.9%), and educational services (-11 jobs, or -6.9%).
Laramie County employment increased by 843 jobs (2.0%) and its total payroll grew by $38.8 million (9.7%). Notable job growth occurred in construction (190 jobs, or 8.6%), transportation & warehousing (138 jobs, or 6.1%), mining (including oil & gas; 122 jobs, or 135.6%), retail trade (119 jobs, or 2.3%), and professional & technical services (115 jobs, or 7.7%). Job losses were seen in manufacturing (-106 jobs, or -7.4%), federal government (-81 jobs, or -3.1%), and state government (-59 jobs, or -1.4%).
Statewide Employment and Wages by Industry
 |
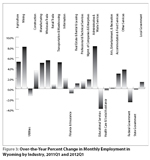 |
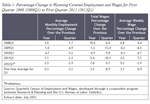
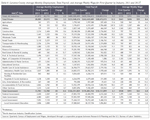
When viewed from an industry perspective, the largest job gains occurred in mining (including oil & gas), accommodation & food services, construction, local government (including public schools, colleges, & hospitals), administrative & waste services, and wholesale trade (see Table 4 and Figure 3). Job losses were seen in federal government, health care & social assistance, educational services, and finance & insurance.
Mining employment grew by 2,129 jobs (8.1%) and its total payroll rose by $72.7 million (13.4%). Oil & gas extraction added more than 200 jobs, mining, except oil & gas added more than 350 jobs, and support activities for mining added more than 1,500 jobs.
Accommodation & food services added 805 jobs (2.9%) and its total payroll increased by $14.9 million (13.6%). Practically all of the job growth occurred in food services.
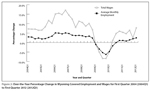
In an apparent reversal of trend, construction employment rose by 627 jobs (3.5%) and its total payroll increased by $12.1 million (6.1%). This sector had lost jobs for 13 consecutive quarters, beginning in fourth quarter 2008. Construction of buildings added nearly 200 jobs, heavy & civil engineering construction added approximately 250 jobs, and specialty trade contractors added nearly 200 jobs.
Local government added 603 jobs (1.3%) and its total payroll grew by $23.1 million (5.3%). Substantial job gains were seen in public hospitals, educational services (including public schools & colleges), and public administration (including cities, towns, & counties).
Employment in administrative & waste services grew by 536 jobs (8.2%) and its total payroll increased by $8.2 million (17.9%). Employment services (including temporary help agencies) added approximately 250 jobs, while services to buildings & dwellings (including janitorial services, snow removal services, and landscaping services) added more than 150 jobs.
Wholesale trade added 474 jobs (5.5%) and its total payroll increased by $15.0 million (13.1%). Some of this growth may be related to increasing oil & gas activity in the state.
Federal government lost187 jobs (-2.6%), but its total payroll increased by $7.0 million (7.1%). Employment decreased slightly across many different federal agencies.
Health care & social assistance employment fell by 106 jobs (-0.4%), but its total payroll rose by $9.4 million (4.4%). This sector grew steadily for many years, even adding jobs when total employment fell in 2009 and 2010. It is unclear whether this quarter's employment decline represents a change in trend, or if it is simply an isolated one-quarter decrease. Private hospitals shed 240 jobs (-7.1%) and social assistance shed 129 jobs (-1.9%). Within social assistance, job losses were seen in several areas, such as individual & family services, vocational rehabilitation services, and child day care services. Ambulatory health care services (including doctor's offices) added 184 jobs (2.1%).
Employment in educational services fell by 64 jobs (-3.9%) and its total payroll rose by $0.7 million (6.8%). Most of the job losses occurred in technical & trade schools and other schools & instruction.
Finance & insurance lost 61 jobs (-0.9%), but its total payroll grew by $2.1 million (2.5%). Modest job gains in insurance carriers & related activities were more than offset by job losses in credit intermediation & related activities.
In summary, job growth accelerated in first quarter and total payroll rebounded from its weakness in fourth quarter. The largest job gains occurred in mining (including oil & gas) and construction employment increased for the first time since 2008.
References
Consensus Revenue Estimating Group (CREG). (2010, October). Wyoming state government revenue forecast fiscal year 2011-fiscal year 2016. Retrieved February 17, 2011 from http://eadiv.state.wy.us/creg/GreenCREG_Oct10.pdf
U.S. Bureau of Economic Analysis. (2011, March 16). SA04 State income and employment summary -- Wyoming. Retrieved March 16, 2011, from http://www.bea.gov/regional/spi/default.cfm