
Labor Market Information > Wyoming Labor Force Trends > October 2011 > Economic Indicators
Economic Indicators
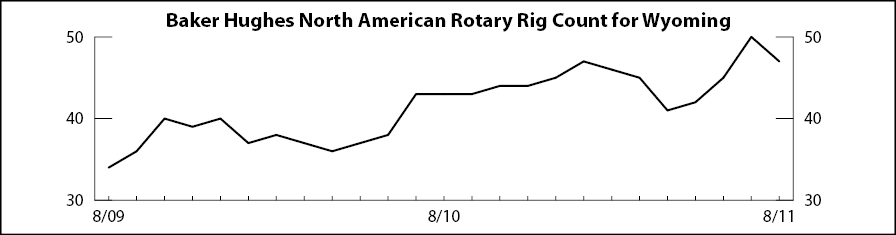
The Baker Hughes rig count increased by 9.3% from August 2010 to August 2011.
| Aug | Jul | Aug | Percent Change | ||||
|---|---|---|---|---|---|---|---|
| 2011 (p) | 2011 (r) | 2010 (b) | Month | Year | |||
| Wyoming Total Nonfarm Employment | 298,000 | 298,100 | 288,900 | 0 | 3.1 | ||
| Wyoming State Government | 16,300 | 16,500 | 15,800 | -1.2 | 3.2 | ||
| Laramie County Nonfarm Employment | 44,500 | 44,500 | 44,100 | 0 | 0.9 | ||
| Natrona County Nonfarm Employment | 40,000 | 40,100 | 38,600 | -0.2 | 3.6 | ||
| Selected U.S. Employment Data | |||||||
| U.S. Multiple Jobholders | 6,649,000 | 6,724,000 | 6,515,000 | -1.1 | 2.1 | ||
| As a percent of all workers | 4.70% | 4.80% | 4.70% | N/A | N/A | ||
| U.S. Discouraged Workers | 977,000 | 1,119,000 | 1,110,000 | -12.7 | -12 | ||
| U.S. Part Time for Economic Reasons | 8,604,000 | 8,514,000 | 8,628,000 | 1.1 | -0.3 | ||
| Wyoming Unemployment Insurance | |||||||
| Weeks Compensated | 18,283 | 17,288 | 24,040 | 5.8 | -23.9 | ||
| Benefits Paid | $5,978,200 | $5,633,695 | $7,921,332 | 6.1 | -24.5 | ||
| Average Weekly Benefit Payment | $326.98 | $325.87 | $329.51 | 0.3 | -0.8 | ||
| State Insured Covered Jobs1 | 265,309 | 264,502 | 264,978 | 0.3 | 0.1 | ||
| Insured Unemployment Rate | 1.70% | 1.80% | 2.30% | N/A | N/A | ||
| Consumer Price Index (U) for All U.S. Urban Consumers | |||||||
| (1982 to 1984 = 100) | |||||||
| All Items | 226.5 | 225.9 | 218.3 | 0.3 | 3.8 | ||
| Food & Beverages | 229.5 | 228.3 | 219.9 | 0.5 | 4.4 | ||
| Housing | 220.5 | 220.2 | 217 | 0.1 | 1.6 | ||
| Apparel | 121.5 | 118.8 | 116.7 | 2.3 | 4.2 | ||
| Transportation | 216.1 | 216.2 | 193.5 | 0 | 11.7 | ||
| Medical Care | 400.9 | 400.3 | 388.5 | 0.1 | 3.2 | ||
| Recreation (Dec. 1997=100) | 113.6 | 113.5 | 113.5 | 0.1 | 0.1 | ||
| Education & Comm. (Dec. 1997=100) | 132 | 130.9 | 130.6 | 0.9 | 1.1 | ||
| Other Goods & Services | 387.1 | 386.5 | 383.7 | 0.1 | 0.9 | ||
| Producer Prices (1982 to 1984 = 100) | |||||||
| All Commodities | 203.2 | 204.6 | 184.9 | -0.7 | 9.9 | ||
| Wyo. Bldg. Permits (New Privately Owned Housing Units Authorized) | |||||||
| Valuation | $32,954,000 | $41,787,000 | $29,760,000 | -21.1 | 10.7 | ||
| Single Family Homes | 119 | 136 | 91 | -12.5 | 30.8 | ||
| Valuation | $25,964,000 | $37,329,000 | $28,686,000 | -30.4 | -9.5 | ||
| Casper MSA2 Building Permits | 98 | 67 | 27 | 46.3 | 263 | ||
| Valuation | $8,288,000 | $5,963,000 | $3,237,000 | 39 | 156 | ||
| Cheyenne MSA Building Permits | 21 | 14 | 13 | 50 | 61.5 | ||
| Valuation | $3,482,000 | $2,398,000 | $2,095,000 | 45.2 | 66.2 | ||
| Baker Hughes North American Rotary Rig Count for Wyoming | 47 | 50 | 43 | -6 | 9.3 | ||
 |
|||||||
| (p) Preliminary. (r) Revised. (b) Benchmarked. | |||||||
| 1Local Area Unemployment Statistics Program estimates. | |||||||
| 2Metropolitan Statistical Area. | |||||||
| Note: Production worker hours and earnings data have been dropped from the Economic Indicators page because of problems with accuracy due to a small sample size and high item nonresponse. The Bureau of Labor Statistics will continue to publish these data online at http://www.bls.gov/eag/eag.wy.htm | |||||||