
Potential Impacts of the Patient Protection and Affordable Care Act on Employer-Provided Benefits in Wyoming (Tables and Figures)
See Related Article
Tables 1, 2, 3, 4, 5, 6, 7, 8, 9
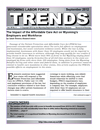
Figures 1, 2
| Number of Employees per Firm | Total Firms | % of All Firms | ||||||||||
|---|---|---|---|---|---|---|---|---|---|---|---|---|
| <50 | 50-59 | 60-79 | 80-99 | >100 | ||||||||
| n | % | n | % | n | % | n | % | n | % | n | % | |
| Total Responses | 21,068 | 100.0% | 140 | 100.0% | 166 | 100.0% | 89 | 100.0% | 418 | 100.0% | 21,881 | 100.0% |
| Natural Resources & Mining | 1,342 | 6.4% | 10 | 7.1% | 17 | 10.2% | 15 | 16.9% | 54 | 12.9% | 1,438 | 6.6% |
| Construction | 3,480 | 16.5% | 11 | 7.9% | 16 | 9.6% | 5 | 5.6% | 22 | 5.3% | 3,534 | 16.2% |
| Manufacturing | 543 | 2.6% | 4 | 2.9% | 7 | 4.2% | 7 | 7.9% | 22 | 5.3% | 583 | 2.7% |
| Trade, Transp., & Utilities | 3,917 | 18.6% | 30 | 21.4% | 40 | 24.1% | 12 | 13.5% | 63 | 15.1% | 4,063 | 18.6% |
| Information | 281 | 1.3% | 5 | 3.6% | 8 | 4.8% | 2 | 2.2% | 6 | 1.4% | 302 | 1.4% |
| Financial Activities | 1,689 | 8.0% | 12 | 8.6% | 9 | 5.4% | 5 | 5.6% | 12 | 2.9% | 1,727 | 7.9% |
| Prof. & Business Services | 3,972 | 18.9% | 11 | 7.9% | 15 | 9.0% | 2 | 2.2% | 11 | 2.6% | 4,011 | 18.3% |
| Educational & Health Services | 1,798 | 8.5% | 24 | 17.1% | 22 | 13.3% | 10 | 11.2% | 115 | 27.5% | 1,970 | 9.0% |
| Leisure & Hospitality | 1,999 | 9.5% | 25 | 17.9% | 23 | 13.9% | 17 | 19.1% | 48 | 11.5% | 2,113 | 9.7% |
| Other Services | 1,767 | 8.4% | 3 | 2.1% | 2 | 1.2% | 2 | 2.2% | 6 | 1.4% | 1,780 | 8.1% |
| Public Admin. (State & Local Government) | 280 | 1.3% | 5 | 3.6% | 7 | 4.2% | 12 | 13.5% | 59 | 14.1% | 363 | 1.7% |
| Source: Quarterly Census of Employment and Wages. | ||||||||||||
| Firm Size | Returned Surveys |
Total Firms |
Response Rate |
Employees |
|---|---|---|---|---|
| <50 | 1,859 | 21,068 | 8.8% | 15,767 |
| 50-59 | 24 | 140 | 17.1% | 1,299 |
| 60-79 | 25 | 166 | 15.1% | 1,699 |
| 80-99 | 28 | 89 | 31.5% | 2,492 |
| >100 | 95 | 418 | 22.7% | 50,992 |
| All Sizes | 2,031 | 21,881 | 9.3% | 72,249 |
| Firm Size (by Number of Employees) | ||||||
|---|---|---|---|---|---|---|
| Total, All Firm Sizes | ||||||
| <50 | 50-59 | 60-79 | 80-99 | >100 | ||
| Full-Time Employment | 18.9% | 1.5% | 2.3% | 3.2% | 74.2% | 100.0% |
| 43,039 | 3,452 | 5,193 | 7,249 | 169,085 | 228,018 | |
| Total Firms | 96.5% | 0.7% | 0.7% | 0.4% | 1.7% | |
| 22,351 | 157 | 167 | 89 | 397 | 23,161 | |
| Firms Offering Health Insurance | 40.8% | 95.8% | 76.0% | 96.4% | 97.9% | |
| 9,119 | 150 | 127 | 86 | 389 | 9,871 | |
| Workers Offered Health Insurance | 60.1% | 88.5% | 81.9% | 95.0% | 93.9% | |
| 25,867 | 3,055 | 4,253 | 6,887 | 158,771 | 198,832 | |
| Workers Enrolled in Health Insurance | 12.2% | 1.4% | 1.9% | 3.6% | 81.0% | |
| 5,242 | 49 | 97 | 258 | 136,897 | 142,543 | |
| Firms Offering Dependent Health Insurance | 33.6% | 95.8% | 76.0% | 89.3% | 97.9% | |
| 7,510 | 150 | 127 | 79 | 389 | 8,255 | |
| Workers Offered Dependent Health Insurance | 52.3% | 86.4% | 79.8% | 89.5% | 92.0% | |
| 22,510 | 2,982 | 4,144 | 6,488 | 155,558 | 191,682 | |
| Part-Time Employment | 36.4% | 3.2% | 2.7% | 4.8% | 52.9% | 100.0% |
| 16,770 | 1,476 | 1,252 | 2,204 | 24,346 | 46,048 | |
| Firms Offering Health Insurance | 2.9% | 20.8% | 0.0% | 10.7% | 28.4% | |
| 648 | 33 | 0 | 10 | 113 | 803 | |
| Workers Offered Health Insurance | 4.0% | 14.1% | 0.0% | 2.6% | 24.5% | |
| 671 | 208 | 0 | 57 | 5,965 | 6,901 | |
| Workers Enrolled in Health Insurance | 10.5% | 4.9% | 0.0% | 0.8% | 83.9% | |
| 1,762 | 72 | 0 | 17 | 20,418 | 22,268 | |
| Firms Offering Dependent Health Insurance | 2.1% | 16.7% | 0.0% | 10.7% | 27.4% | |
| 469 | 26 | 0 | 10 | 109 | 614 | |
| Workers Offered Dependent Health Insurance | 3.6% | 6.4% | 0.0% | 2.6% | 17.3% | |
| 604 | 94 | 0 | 57 | 4,212 | 4,967 | |
| Source: Wyoming Benefits Survey. | ||||||
| Benefit Type | Full-Time | Part-Time | ||||||
|---|---|---|---|---|---|---|---|---|
| 2008 | 2009 | 2010 | 2011 | 2008 | 2009 | 2010 | 2011 | |
| Child Care | 2.6% | 1.7% | 2.5% | 2.0% | 1.1% | 1.1% | 1.4% | 1.1% |
| Dental Plan | 27.2% | 28.3% | 29.2% | 30.7% | 3.3% | 4.1% | 3.4% | 5.3% |
| Dependent Health Insurance | 34.3% | 36.1% | 35.5% | 34.9% | 2.7% | 4.8% | 3.9% | 4.7% |
| Educational/Tuition Assistance | 23.2% | 21.9% | 22.2% | 22.9% | 10.8% | 7.5% | 8.7% | 9.4% |
| Flexible Spending Account | 9.9% | 11.8% | 12.2% | 11.4% | 1.8% | 2.0% | 2.4% | 2.4% |
| Health Insurance | 42.7% | 44.3% | 44.6% | 42.5% | 6.0% | 6.1% | 6.0% | 5.6% |
| Hiring Bonus | 6.4% | 6.2% | 4.9% | 5.2% | 1.6% | 1.1% | 0.6% | 1.3% |
| Life Insurance | 26.9% | 28.0% | 27.5% | 27.7% | 4.6% | 4.1% | 3.5% | 4.0% |
| Long-Term Disability | 11.2% | 12.5% | 12.7% | 12.7% | 2.0% | 1.6% | 1.8% | 2.1% |
| Paid Holidays | 55.5% | 54.7% | 56.0% | 54.8% | 18.1% | 17.6% | 17.7% | 15.8% |
| Paid Personal Leave | 23.6% | 30.6% | 25.3% | 20.6% | 6.9% | 6.8% | 6.2% | 5.5% |
| Paid Sick Leave | 26.9% | 28.7% | 27.8% | 27.7% | 5.5% | 6.7% | 5.1% | 5.1% |
| Paid Vacation | 55.3% | 56.0% | 52.7% | 49.5% | 12.9% | 11.9% | 11.3% | 10.7% |
| Retirement Plan | 34.8% | 31.0% | 32.3% | 32.3% | 8.1% | 6.5% | 6.2% | 6.1% |
| Short-Term Disability | 11.9% | 12.0% | 12.3% | 13.4% | 1.6% | 1.7% | 2.1% | 2.4% |
| Vision Plan | 15.5% | 16.6% | 17.8% | 18.5% | 1.8% | 2.3% | 3.5% | 3.5% |
| Source: Wyoming Benefits Survey. | ||||||||
| Industry | |||||||||||||
|---|---|---|---|---|---|---|---|---|---|---|---|---|---|
| Benefit Type | All Industries | Mining | Construction | Manufacturing | Trade, Transp., & Utilities | Information | Financial Activities | Prof. & Business Services | Educational & Health Svcs. | Leisure & Hospitality | Other Services | State & Local Govt. | |
| Full-Time Employees | |||||||||||||
| Child Care | 9.1 | 6.3 | 2.5 | 3.5 | 0.1 | 0.5 | 0.2 | 2.7 | 16.1 | 24.9 | 3.8 | 21.6 | |
| Dental Plan | 70.4 | 86.0 | 47.2 | 74.2 | 62.9 | 81.7 | 73.2 | 52.9 | 84.6 | 31.6 | 50.4 | 96.5 | |
| Dependent Health Insurance | 73.9 | 89.5 | 51.1 | 80.9 | 71.1 | 83.5 | 73.7 | 61.9 | 84.3 | 32.5 | 57.2 | 96.6 | |
| Educational/Tuition Assistance | 51.8 | 76.8 | 28.1 | 68.5 | 44.0 | 21.4 | 51.1 | 36.8 | 64.1 | 17.0 | 17.6 | 69.7 | |
| Flexible Spending Account | 51.9 | 72.7 | 17.8 | 57.2 | 34.5 | 32.3 | 55.9 | 34.7 | 75.0 | 32.1 | 30.1 | 66.5 | |
| Health Insurance | 77.7 | 91.0 | 57.3 | 85.6 | 75.5 | 86.7 | 79.9 | 70.5 | 87.8 | 34.6 | 62.8 | 97.0 | |
| Hiring Bonus | 19.6 | 67.2 | 8.1 | 11.6 | 12.2 | 2.0 | 27.1 | 3.6 | 21.0 | 9.7 | 4.0 | 0.1 | |
| Life Insurance | 68.8 | 86.6 | 45.4 | 80.7 | 60.3 | 61.1 | 70.1 | 52.9 | 81.4 | 29.0 | 50.6 | 95.6 | |
| Long-Term Disability | 46.8 | 76.1 | 18.5 | 64.8 | 33.7 | 41.9 | 64.0 | 28.9 | 60.7 | 11.8 | 24.5 | 56.8 | |
| Paid Holidays | 78.9 | 90.7 | 62.5 | 93.9 | 80.3 | 93.1 | 89.3 | 79.3 | 84.4 | 19.9 | 66.2 | 99.5 | |
| Paid Personal Leave | 35.2 | 40.6 | 29.8 | 19.0 | 40.0 | 50.7 | 44.3 | 27.7 | 45.9 | 11.4 | 24.2 | 27.9 | |
| Paid Sick Leave | 50.9 | 59.4 | 17.3 | 52.6 | 35.3 | 41.7 | 53.9 | 41.6 | 72.6 | 40.8 | 20.4 | 73.0 | |
| Paid Vacation | 73.0 | 85.0 | 49.6 | 89.9 | 73.3 | 53.0 | 72.3 | 63.7 | 78.0 | 66.0 | 74.0 | 73.5 | |
| Retirement Plan | 73.4 | 87.8 | 61.5 | 86.3 | 65.7 | 79.5 | 80.0 | 71.9 | 83.6 | 44.5 | 52.0 | 76.2 | |
| Short-Term Disability | 39.8 | 73.3 | 23.9 | 62.1 | 30.3 | 44.1 | 53.9 | 27.1 | 42.9 | 14.7 | 31.7 | 32.2 | |
| Vision Plan | 56.2 | 80.8 | 28.6 | 51.3 | 42.1 | 67.6 | 56.0 | 37.2 | 71.8 | 22.2 | 35.5 | 86.2 | |
| Part-Time Employees | |||||||||||||
| Child Care | 6.6 | 2.3 | 1.2 | 3.1 | 0.0 | 0.3 | 0.0 | 0.0 | 11.4 | 12.4 | 0.0 | 7.2 | |
| Dental Plan | 9.9 | 5.8 | 1.7 | 7.4 | 7.4 | 2.8 | 17.7 | 6.3 | 21.9 | 3.8 | 0.8 | 12.2 | |
| Dependent Health Insurance | 8.1 | 5.3 | 1.9 | 7.4 | 7.1 | 1.4 | 13.0 | 4.0 | 16.2 | 3.7 | 0.4 | 11.7 | |
| Educational/Tuition Assistance | 12.8 | 15.5 | 7.9 | 20.5 | 3.9 | 0.4 | 18.2 | 8.3 | 29.2 | 11.1 | 3.0 | 4.6 | |
| Flexible Spending Account | 9.7 | 9.2 | 0.9 | 7.4 | 0.6 | 1.1 | 17.0 | 1.8 | 35.3 | 4.0 | 0.4 | 15.3 | |
| Health Insurance | 9.7 | 6.5 | 2.0 | 7.4 | 9.8 | 2.8 | 11.2 | 4.0 | 20.6 | 3.7 | 2.4 | 11.8 | |
| Hiring Bonus | 1.7 | 6.8 | 0.0 | 8.4 | 0.2 | 0.0 | 5.8 | 0.8 | 2.7 | 2.6 | 0.0 | 0.0 | |
| Life Insurance | 9.3 | 6.7 | 1.9 | 7.4 | 8.3 | 4.3 | 12.2 | 5.3 | 19.4 | 2.3 | 1.7 | 17.0 | |
| Long-Term Disability | 4.9 | 5.8 | 0.2 | 0.0 | 0.2 | 0.4 | 2.2 | 5.0 | 14.7 | 0.5 | 0.4 | 10.9 | |
| Paid Holidays | 19.7 | 14.0 | 9.2 | 20.0 | 15.6 | 4.4 | 24.4 | 18.9 | 35.5 | 10.6 | 12.2 | 26.3 | |
| Paid Personal Leave | 13.0 | 15.6 | 2.3 | 0.5 | 0.2 | 1.4 | 22.5 | 6.1 | 43.0 | 4.5 | 9.5 | 0.1 | |
| Paid Sick Leave | 14.7 | 9.0 | 2.7 | 1.6 | 6.1 | 0.0 | 15.3 | 4.3 | 43.4 | 2.0 | 3.5 | 22.6 | |
| Paid Vacation | 14.6 | 17.2 | 2.5 | 10.9 | 4.7 | 2.6 | 22.5 | 12.9 | 20.9 | 16.9 | 12.5 | 22.9 | |
| Retirement Plan | 24.9 | 17.2 | 3.7 | 19.6 | 17.0 | 19.1 | 32.9 | 18.9 | 52.9 | 14.3 | 7.3 | 20.7 | |
| Short-Term Disability | 4.6 | 5.8 | 0.2 | 0.0 | 0.2 | 4.3 | 2.3 | 6.4 | 13.6 | 0.8 | 0.4 | 5.8 | |
| Vision Plan | 7.9 | 5.8 | 2.2 | 7.4 | 1.7 | 0.4 | 6.7 | 2.2 | 21.2 | 4.3 | 1.2 | 12.2 | |
| Source: Wyoming Benefits Survey. | |||||||||||||
| Gender | Age | n | Age % | Gender % | Average Annual Wage |
|---|---|---|---|---|---|
| Women | 0-19 | 9,461 | 7.1% | $4,591 | |
| 20-24 | 14,921 | 11.1% | $12,342 | ||
| 25-34 | 28,852 | 21.5% | $23,768 | ||
| 35-44 | 24,310 | 18.1% | $30,504 | ||
| 45-54 | 28,387 | 21.2% | $33,351 | ||
| 55-64 | 22,218 | 16.6% | $33,281 | ||
| 65+ | 5,991 | 4.5% | $18,167 | ||
| Unknown | 7 | 0.0% | $18,943 | ||
| Total | 134,147 | 100.0% | 37.8% | $25,719 | |
| Men | 0-19 | 9,698 | 6.2% | $5,940 | |
| 20-24 | 16,992 | 10.8% | $20,644 | ||
| 25-34 | 37,150 | 23.6% | $39,972 | ||
| 35-44 | 30,069 | 19.1% | $51,554 | ||
| 45-54 | 31,557 | 20.0% | $57,284 | ||
| 55-64 | 24,777 | 15.7% | $57,845 | ||
| 65+ | 7,256 | 4.6% | $33,614 | ||
| Unknown | 10 | 0.0% | $35,650 | ||
| Total | 157,509 | 100.0% | 44.4% | $43,989 | |
| Unknown | 0-19 | 22 | 0.0% | $37,966 | |
| 20-24 | 33 | 0.1% | $17,199 | ||
| 25-34 | 461 | 0.7% | $43,875 | ||
| 35-44 | 535 | 0.9% | $53,490 | ||
| 45-54 | 482 | 0.8% | $58,937 | ||
| 55-64 | 520 | 0.8% | $56,221 | ||
| 65+ | 102 | 0.2% | $38,644 | ||
| Unknown | 60,629 | 96.6% | $15,324 | ||
| Total | 62,784 | 100.0% | 17.7% | $16,579 | |
| Total | 0-19 | 19,181 | 5.4% | $5,311 | |
| 20-24 | 31,946 | 9.0% | $16,763 | ||
| 25-34 | 66,463 | 18.8% | $32,965 | ||
| 35-44 | 54,914 | 15.5% | $42,254 | ||
| 45-54 | 60,426 | 17.0% | $46,054 | ||
| 55-64 | 47,515 | 13.4% | $46,341 | ||
| 65+ | 13,349 | 3.8% | $26,720 | ||
| Unknown | 60,646 | 17.1% | $15,328 | ||
| Total | 354,440 | 100.0% | 100.0% | $32,219 | |
| Source: Wyoming Wage Records. Available at http://doe.state.wy.us/LMI/earnings_tables/2012/index.htm | |||||
| Women | Men | |||||
|---|---|---|---|---|---|---|
| n | Average Annual Wages | % of FPLa | n | Average Annual Wages | % of FPLa | |
| Natural Resources & Mining | 301 | $21,938 | 201.5% | 2,729 | $38,146 | 350.3% |
| Construction | 235 | $15,439 | 141.8% | 2,494 | $21,031 | 193.1% |
| Manufacturing | 243 | $15,020 | 137.9% | 760 | $25,153 | 231.0% |
| Wholesale Trade, Transportation & Utilities | 373 | $16,668 | 153.1% | 1,131 | $30,713 | 282.0% |
| Retail Trade | 2,963 | $10,696 | 98.2% | 2,661 | $14,556 | 133.7% |
| Information | 173 | $13,975 | 128.3% | 183 | $15,104 | 138.7% |
| Financial Activities | 638 | $15,814 | 145.2% | 350 | $20,483 | 188.1% |
| Professional & Business Services | 870 | $11,698 | 107.4% | 1,265 | $16,386 | 150.5% |
| Educational Services | 1,035 | $12,735 | 116.9% | 549 | $9,624 | 88.4% |
| Health Care & Social Assistance | 2,902 | $15,418 | 141.6% | 535 | $15,599 | 143.2% |
| Leisure & Hospitality | 4,058 | $8,832 | 81.1% | 2,840 | $9,495 | 87.2% |
| Other Services | 468 | $11,796 | 108.3% | 601 | $21,628 | 198.6% |
| Public Admin. (State & Local Govt.) | 604 | $15,891 | 145.9% | 776 | $19,346 | 177.6% |
| aFPL = Federal Poverty Level. In 2011, the Federal Poverty Level was $10,890 annually; Workers earning less than 138% of the FPL ($15,028) were considered low-income. Shaded cells indicate average annual wages lower than the 138% of FPL standard for low income. | ||||||
| Year | Age Category | |||||||
|---|---|---|---|---|---|---|---|---|
| 0-19 | 20-24 | 25-34 | 35-44 | 45-54 | 55-64 | 65+ | Unknown | |
| 1992 | 10.1% | 11.0% | 23.1% | 24.3% | 13.5% | 6.6% | 2.1% | 9.4% |
| 1993 | 10.6% | 11.5% | 22.9% | 24.9% | 14.2% | 6.6% | 2.0% | 7.4% |
| 1994 | 10.7% | 11.5% | 22.0% | 25.0% | 14.9% | 6.8% | 2.2% | 7.1% |
| 1995 | 10.6% | 11.4% | 21.7% | 25.0% | 15.5% | 6.8% | 2.0% | 7.1% |
| 1996 | 10.5% | 11.2% | 21.0% | 24.6% | 16.2% | 6.9% | 2.2% | 7.6% |
| 1997 | 10.5% | 11.4% | 20.3% | 24.3% | 16.9% | 7.1% | 2.1% | 7.5% |
| 1998 | 10.4% | 11.2% | 19.3% | 23.4% | 17.3% | 7.4% | 2.2% | 8.9% |
| 1999 | 10.3% | 11.0% | 18.5% | 22.2% | 17.6% | 7.6% | 2.2% | 10.6% |
| 2000 | 10.4% | 11.2% | 18.2% | 21.6% | 18.3% | 7.8% | 2.3% | 10.2% |
| 2001 | 9.7% | 10.8% | 17.3% | 19.9% | 18.3% | 8.0% | 2.4% | 13.6% |
| 2002 | 9.4% | 10.8% | 17.5% | 19.2% | 18.9% | 8.8% | 2.5% | 12.9% |
| 2003 | 8.9% | 10.8% | 17.4% | 18.1% | 19.0% | 9.3% | 2.6% | 14.0% |
| 2004 | 8.7% | 10.8% | 17.7% | 17.6% | 19.3% | 9.9% | 2.8% | 13.1% |
| 2005 | 8.5% | 10.7% | 17.6% | 16.9% | 19.3% | 10.4% | 2.9% | 13.8% |
| 2006 | 8.2% | 10.0% | 17.2% | 16.1% | 18.6% | 10.6% | 3.0% | 16.4% |
| 2007 | 7.6% | 9.7% | 17.1% | 15.4% | 17.9% | 10.9% | 3.1% | 18.4% |
| 2008 | 6.9% | 9.4% | 17.4% | 15.1% | 17.6% | 11.3% | 3.2% | 19.1% |
| 2009 | 5.9% | 9.3% | 18.3% | 15.5% | 18.0% | 12.4% | 3.5% | 17.2% |
| 2010 | 5.3% | 8.8% | 18.2% | 15.2% | 17.5% | 13.0% | 3.6% | 18.4% |
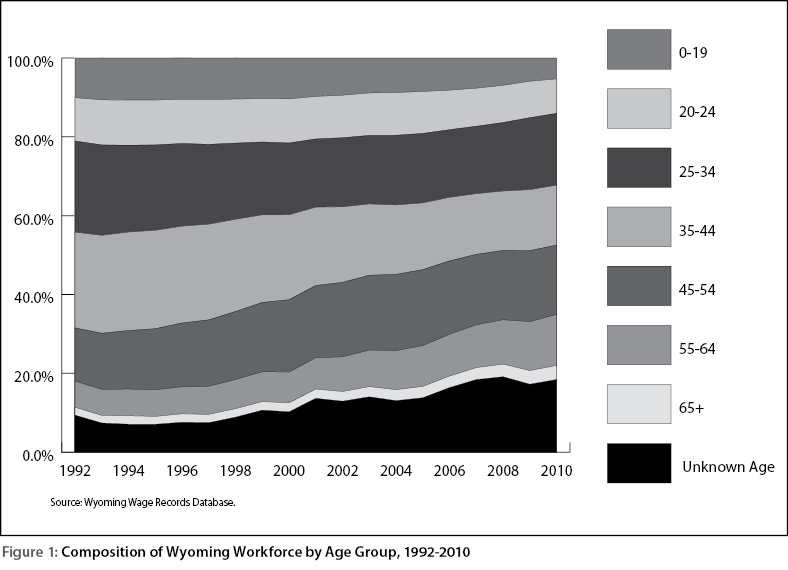
| 2006 | 2007 | 2008 | 2009 | 2010 | 2011 | |||||||
|---|---|---|---|---|---|---|---|---|---|---|---|---|
| n | % | n | % | n | % | n | % | n | % | n | % | |
| Statewide | 56,837 | 16.1 | 67,147 | 18.0 | 70,328 | 18.5 | 56,440 | 15.9 | 64,347 | 18.4 | 62,784 | 17.7% |
| Albany | 2,256 | 12.4 | 2,393 | 12.7 | 2,313 | 12.5 | 2,078 | 11.5 | 2,260 | 13.0 | 2,262 | 14.1 |
| Big Horn | 347 | 7.1 | 435 | 8.6 | 441 | 8.6 | 394 | 8.1 | 464 | 9.5 | 508 | 9.9 |
| Campbell | 8,543 | 21.8 | 10,170 | 24.1 | 11,903 | 26.0 | 9,789 | 22.9 | 10,126 | 24.9 | 4,038 | 12.1 |
| Carbon | 1,314 | 14.9 | 1545 | 16.4 | 1673 | 17.3 | 1,339 | 15.0 | 2,017 | 22.0 | 1,409 | 16.8 |
| Converse | 506 | 8.7 | 696 | 11.3 | 969 | 14.4 | 694 | 11.0 | 774 | 12.4 | 787 | 12.0 |
| Crook | 658 | 20.9 | 729 | 22.1 | 812 | 23.3 | 744 | 22.2 | 851 | 25.4 | 338 | 13.5 |
| Fremont | 1,753 | 8.7 | 2,124 | 10.1 | 2,269 | 10.6 | 2,101 | 10.1 | 2,411 | 11.7 | 2,534 | 12.5 |
| Goshen | 756 | 13.5 | 807 | 14.1 | 1,068 | 17.6 | 972 | 16.3 | 1,050 | 17.5 | 638 | 11.8 |
| Hot Springs | 157 | 6.6 | 165 | 6.8 | 183 | 7.2 | 189 | 7.7 | 232 | 9.6 | 235 | 9.6 |
| Johnson | 510 | 12.3 | 545 | 12.7 | 627 | 14.2 | 559 | 13.2 | 561 | 13.6 | 419 | 10.7 |
| Laramie | 7,230 | 13.5 | 8,329 | 15.0 | 8,057 | 14.5 | 7,112 | 13.4 | 7,736 | 14.9 | 8,112 | 16.7 |
| Lincoln | 919 | 12.0 | 2,601 | 26.1 | 1,901 | 20.9 | 1,135 | 14.5 | 1,000 | 13.9 | 1,331 | 16.5 |
| Natrona | 5,992 | 11.7 | 5,785 | 11.1 | 6,753 | 12.5 | 4,668 | 9.4 | 5,621 | 11.6 | 4,480 | 9.4 |
| Niobrara | 93 | 9.5 | 96 | 9.4 | 117 | 11.1 | 123 | 11.4 | 133 | 12.6 | 84 | 8.4 |
| Park | 3,579 | 19.4 | 3,813 | 20.1 | 3,872 | 20.3 | 3,712 | 19.9 | 4,139 | 22.5 | 2,240 | 14.4 |
| Platte | 593 | 13.4 | 578 | 13.3 | 564 | 13.3 | 550 | 12.8 | 629 | 14.3 | 535 | 12.5 |
| Sheridan | 1,199 | 7.9 | 1534 | 9.6 | 1,555 | 9.6 | 1,334 | 8.7 | 1,474 | 10.0 | 1,438 | 10.1 |
| Sublette | 1,393 | 22.5 | 1,626 | 23.8 | 1,743 | 24.2 | 1,392 | 21.3 | 1,645 | 26.0 | 2,304 | 29.6 |
| Sweetwater | 4,882 | 15.4 | 6,022 | 17.8 | 6,307 | 18.2 | 3,967 | 13.1 | 5,029 | 16.7 | 4,038 | 13.5 |
| Teton | 7,481 | 30.9 | 8,471 | 33.5 | 8,812 | 34.4 | 7,076 | 30.9 | 7,342 | 33.5 | 6,895 | 30.5 |
| Uinta | 2,332 | 18.5 | 2,248 | 17.4 | 2,562 | 18.9 | 1,425 | 12.3 | 1,965 | 17.0 | 2,110 | 18.9 |
| Washakie | 354 | 7.5 | 443 | 9.1 | 543 | 10.7 | 435 | 9.0 | 506 | 10.3 | 339 | 7.6 |
| Weston | 1,767 | 35.0 | 2,353 | 40.6 | 2,072 | 37.7 | 2,070 | 38.3 | 2,140 | 41.3 | 248 | 9.2 |
| Nonresident, Unknown County | 2,223 | 3.9 | 3,639 | 5.4 | 3,212 | 4.6 | 2,582 | 4.6 | 4,242 | 6.6 | 15,462 | 24.6 |