Wyoming Normalizeda Unemployment Insurance Statistics: Continued Claims
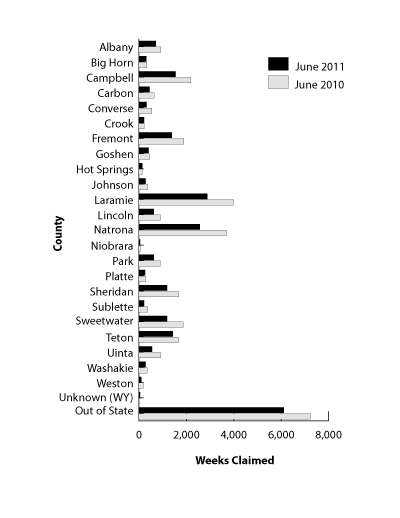
Continued claims were 24.7% lower in June 2011 than in June 2010. All reported sectors at the statewide level showed over-the-year declines in claims activity.
| Percent Change Weeks Claimed |
|||||
|---|---|---|---|---|---|
| Continued Weeks Claimed | Jun 11 | Jun 11 | |||
| Jun 11 | May 11 | Jun 10 | May 11 | Jun 10 | |
| Total Continued Weeks Claimed | 23,902 | 28,720 | 31,751 | -16.8 | -24.7 |
| Extended Benefit Weeks Claimed | 14,800 | 16,678 | 20,922 | -11.3 | -29.3 |
| Total Unique Claimantsb | 6,078 | 8,507 | 7,828 | -28.6 | -22.4 |
| Benefit Exhaustions | 622 | 877 | 1,002 | -29.1 | -37.9 |
| Benefit Exhaustion Rates | 10.2% | 10.3% | 12.8% | -0.1% | -2.6% |
| Goods-Producing | 7,648 | 9,274 | 11,347 | -17.5 | -32.6 |
| Natural Resources and Mining | 1,486 | 1,710 | 2,077 | -13.1 | -28.5 |
| Mining | 1,324 | 1,524 | 1,866 | -13.1 | -29.0 |
| Oil & Gas Extraction | 92 | 115 | 135 | -20.0 | -31.9 |
| Construction | 5,305 | 6,506 | 7,828 | -18.5 | -32.2 |
| Manufacturing | 857 | 1,058 | 1,442 | -19.0 | -40.6 |
| Service-Providing | 11,068 | 13,995 | 14,604 | -20.9 | -24.2 |
| Trade, Transportation, and Utilities | 3,331 | 3,885 | 4,692 | -14.3 | -29.0 |
| Wholesale Trade | 486 | 503 | 874 | -3.4 | -44.4 |
| Retail Trade | 2,085 | 2,446 | 2,807 | -14.8 | -25.7 |
| Transportation, Warehousing and Utilities | 760 | 936 | 1,011 | -18.8 | -24.8 |
| Information | 203 | 200 | 254 | 1.5 | -20.1 |
| Financial Activities | 468 | 492 | 887 | -4.9 | -47.2 |
| Professional and Business Services | 1,630 | 1,911 | 2,281 | -14.7 | -28.5 |
| Educational and Health Services | 1,841 | 1,598 | 1,971 | 15.2 | -6.6 |
| Leisure and Hospitality | 3,009 | 5,287 | 3,587 | -43.1 | -16.1 |
| Other Services, except Public Admin. | 586 | 622 | 932 | -5.8 | -37.1 |
| Government | 2,043 | 2,201 | 2,446 | -7.2 | -16.5 |
| Federal Government | 465 | 791 | 701 | -41.2 | -33.7 |
| State Government | 251 | 254 | 276 | -1.2 | -9.1 |
| Local Government | 1,327 | 1,156 | 1,469 | 14.8 | -9.7 |
| Local Education | 362 | 211 | 380 | 71.6 | -4.7 |
| Unclassified | 3,143 | 3,250 | 3,354 | -3.3 | -6.3 |
| Percent Change Weeks Claimed |
|||||
|---|---|---|---|---|---|
| Continued Weeks Claimed | Jun 11 | Jun 11 | |||
| Jun 11 | May 11 | Jun 10 | May 11 | Jun 10 | |
| Total Continued Weeks Claimed | 2,880 | 2,962 | 3,987 | -2.8 | -27.8 |
| Total Unique Claimants | 708 | 861 | 987 | -17.8 | -28.3 |
| Goods-Producing | 734 | 860 | 1,118 | -14.7 | -34.3 |
| Construction | 585 | 739 | 908 | -20.8 | -35.6 |
| Service-Providing | 1,673 | 1,631 | 2,269 | 2.6 | -26.3 |
| Trade, Transportation, and Utilities | 470 | 515 | 830 | -8.7 | -43.4 |
| Financial Activities | 102 | 95 | 187 | 7.4 | -45.5 |
| Professional and Business Services | 257 | 262 | 362 | -1.9 | -29.0 |
| Educational and Health Services | 454 | 403 | 344 | 12.7 | 32.0 |
| Leisure and Hospitality | 245 | 224 | 327 | 9.4 | -25.1 |
| Government | 368 | 352 | 494 | 4.5 | -25.5 |
| Unclassified | 105 | 119 | 106 | -11.8 | -0.9 |
| Percent Change Weeks Claimed |
|||||
|---|---|---|---|---|---|
| Continued Weeks Claimed | Jun 11 | Jun 11 | |||
| Jun 11 | May 11 | Jun 10 | May 11 | Jun 10 | |
| Total Continued Weeks Claimed | 2,569 | 2,845 | 3,686 | -9.7 | -30.3 |
| Total Unique Claimants | 637 | 841 | 899 | -24.3 | -29.1 |
| Goods-Producing | 694 | 825 | 1,221 | -15.9 | -43.2 |
| Construction | 386 | 523 | 737 | -26.2 | -47.6 |
| Service-Providing | 1,733 | 1,826 | 2,226 | -5.1 | -22.1 |
| Trade, Transportation, and Utilities | 594 | 641 | 780 | -7.3 | -23.8 |
| Financial Activities | 67 | 63 | 169 | 6.3 | -60.4 |
| Professional and Business Services | 312 | 340 | 288 | -8.2 | 8.3 |
| Educational and Health Services | 333 | 288 | 401 | 15.6 | -17.0 |
| Leisure and Hospitality | 253 | 296 | 382 | -14.5 | -33.8 |
| Government | 90 | 121 | 180 | -25.6 | -50.0 |
| Unclassified | 52 | 73 | 59 | -28.8 | -11.9 |
aAn average month is considered 4.33 weeks. If a month has four weeks, the normalization factor is 1.0825. If the month has five weeks, the normalization factor is 0.866. The number of raw claims is multiplied by the normalization factor to achieve the normalized claims counts.
bDoes not include claimants receiving extended benefits.