
 Training for What? PART 5
Examining the Gender Wage Gap Among New Hires in Wyoming's Manufacturing Industry
This is the fifth installment in a series of articles examining Wyoming's manufacturing industry. This article analyzes new hires in Wyoming's manufacturing industry and across all industries in order to determine if a wage gap existed within the same occupation for male and female new hires. Within most occupations, there was no evidence of wage disparity between male and female new hires.
An In-Depth Analysis of Wyoming's Manufacturing Industry
The three most recent issues of Wyoming Labor Force Trends have included articles analyzing Wyoming's manufacturing industry. This type of research and analysis can be performed for any of Wyoming's industries by the Research & Planning section of the Wyoming Department of Workforce Services.
Manufacturing Sector in Wyoming
Small but Growing
New Hires and Occupational Projections in
Wyoming's Manufacturing Industry
Training Needs for Wyoming's
Manufacturing Industry
Skills Needs in Manufacturing
Examining the Gender Wage Gap
Among New Hires in Wyoming's Manufacturing Industry
Previous labor market analyses by the Research & Planning (R&P) section of the Wyoming Department of Workforce Services have shown that the gender wage gap in Wyoming is largely due to the industrial structure and distribution of occupations in the state (Jones, 2004, 2007, 2008, and Moore, 2011). Through a U.S. Department of Labor American Recovery and Reinvestment Act (ARRA) grant, R&P earlier this year took this prior research a step further by contrasting newly hired males and females with the same occupation across all industries and specifically in manufacturing.
R&P collected data from a random sample of 11,471 new hires from fourth quarter 2009 to third quarter 2010. These were employees who had not worked for their current employer in the previous 20 years. The data collected include occupations, wages, other benefits, skills, and employers' satisfaction with the work performed. Some new hires were excluded because they were paid a piece rate or commission, and an hourly wage could not be determined. Others were excluded because the employee's gender was not known – primarily nonresidents for whom R&P did not have demographic information. This left an analysis pool of 8,745 workers (see Table 1). More information on this methodology can be found online here.
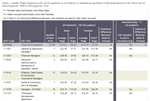 |
Data were aggregated at each industry and occupation level independently. At the finer levels of detail, which include a specific industry or occupation, analysis was restricted to cases where there were at least two males and two females. As a result, the number of new hires for all occupations exceeds the sum of the detail rows in the table.
For each occupation, wages for males and females were compared to determine whether a statistically significant difference in wages existed. For portions of the analysis that address manufacturing occupations specifically, the number of new hires, average wages, and standard deviation of wages were suppressed to protect confidentiality of data for employers and employees. The values in the statistical test column include "F" when the females were paid significantly more than males, "M" when males were paid significantly more than females, "No" when there was no significant difference between wages paid to females and males, and the field is left blank when no data were collected or were suppressed due to the two males/two females rule.
Across all industries and occupations, newly hired males were paid significantly more than newly hired females (see Table 1, row 1). The average hourly wage for males across all industries and occupations was $15.21, compared to $12.19 for females. The standard deviation in the Figure represents the distribution of wages paid for males and females. For example, while the average hourly wage for males was $15.21, some were paid more and others were paid less.
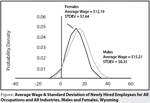 |
The Figure plots the distribution of wages paid to males and females based on the average wage and the standard deviation of the wage of each group, and demonstrates that there is overlap in the wage distributions of males and females. The statistical test applied to this analysis is referred to as a Student's t-test. It is designed to test the hypothesis that there is no difference between the earnings of males and females based not only on the average wage but also the distribution of the wages in the two groups. The significance level selected for the current work was p = .05 on both ends of the distributions. As discussed earlier, males are paid significantly more than females; in statistical terms, there is only a 5% (p = .05) chance that the same results could be reached randomly. This statistical test gives confidence that there is a significant difference between the wages of males and females.
In some instances, a wage gap between males and females within a specific occupation may not exist across all industries, but is present in that same occupation in the manufacturing industry. For example, while there is no statistical difference between males and females hired as counter attendants, cafeteria, food concession, & coffee shop across all industries, there is a statistical difference between male and female new hires in the manufacturing industry.
Another occupation of interest, which is traditionally male-dominated and one of the fastest growing occupations in Wyoming, is truck drivers, heavy & tractor-trailer. Across all industries, males were paid significantly more than females; within the manufacturing industry, however, there was no statistical difference. One of the suggested solutions to address gender wage inequity is to recruit females to traditionally higher-paying, male-dominated occupations. Applying this strategy to the truck drivers occupation may not achieve the desired result.
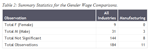 |
R&P has collected data on 184 occupations across all industries for which there is a minimum of two observations for males and two observations for females (see Table 2). Female new hires had significantly higher wages for 9 of the occupations. Males had significantly higher wages for 31 occupations, and the remaining 144 occupations showed no statistical differences between the earnings of males and females.
Within the manufacturing industry, R&P collected data on 11 occupations; in 3 instances, males were paid significantly more than females, while there was no significant difference within the remaining 8 occupations.
Care should be taken exploring the remainder of the data in Table 1, as it is expected that future iterations of this analysis may yield differing results. The statistical analysis used for this research is sensitive to the number of cases observed. A larger number of observations allows a greater confidence in the results. For example, it is unlikely that the results for the occupation of cashiers, for which there were 238 new hires across all industries, will change in future analysis. In contrast, only 7 home health aides were hired during this period; the information for this occupation presented in Table 1 could be drastically changed if one higher paying employer hired 3 home health aides in the next survey panel.
Several variables that need to be considered in subsequent analyses are:
- Age
- Experience of individual in industry
- Residency status of new hire
- Benefits offered
- Job characteristics
- Industry
The experience level of workers was not examined, which could explain some of the differences that were observed. For example, this analysis may be comparing 10 males who have worked in manufacturing for 10 years to 7 females who are just entering the manufacturing industry. The same concepts apply to age, job characteristics, and the remainder of the previously mentioned variables.
This current analysis is a byproduct of research conducted under R&P's ARRA grant to study the impact of current legislation on energy efficiency related occupations. Those studies were designed to determine if there is a difference in earnings between occupations in energy efficient defined companies and all others. For example, do electricians working on windmills and solar panels earn more than electricians in residential construction? To do an in-depth analysis of issues related to gender wage inequities across Wyoming and within specific industries in Wyoming would require additional funding, as the work is not covered by an existing R&P grant. Research funded by the ARRA grant can be found online at R&P's Energy page.
Workforce Information Supervisor Tony Glover can be reached at (307) 473-3826 or tony.glover@wyo.gov.
References
Jones, S. (2004). Worker residency determination — Wyoming stepwise procedure. Wyoming Labor Force Trends, 41(8). Retrieved May 3, 2011, from http://doe.state.wy.us/LMI/0804/a1supp.htm
Jones, S. (2007). Demographic effects of Wyoming's energy-related expansions. Wyoming Labor Force Trends, 44(4). Retrieved April 19, 2011, from http://doe.state.wy.us/LMI/0407/a1.htm
Jones, S. (2008). Examining the wage gap in Wyoming's counties. Wyoming Labor Force Trends, 45(8). Retrieved April 19, 2011, from http://wydoe.state.wy.us/LMI/0808/a1.htm
Knapp, L. (2011). Survey captures data on Wyoming new hires. Wyoming Labor Force Trends, 48(2). Retrieved April 13, 2011, from http://doe.state.wy.us/LMI/0211/a2.htm
Moore, M. (2011). Wyoming new hires: examining the wage gap. Wyoming Labor Force Trends, 48(3). Retrieved September 1, 2011, from http://doe.state.wy.us/LMI/0311/a1.htm