
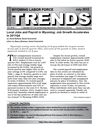
Local Jobs and Payroll in Wyoming: Job Growth Accelerates in 2011Q4
Wyoming's mining sector (including oil & gas) added the largest number of new jobs in fourth quarter 2011, and much of the growth in other sectors appeared related to oil & gas.
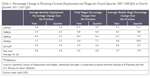 |
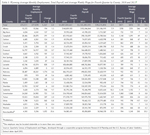
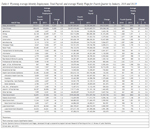
Total unemployment insurance (UI) covered payroll increased by $78.2 million (2.5%) in fourth quarter 2011. Employment rose by 5,367 jobs (2.0%) and average weekly wage increased by $5 (0.6%). Job growth in fourth quarter was higher than its five-year average (2.0% compared to 0.6%; see Table 1). However, growth in total payroll and average weekly wage were both lower than their five-year averages. In terms of dollars, UI covered payroll represents approximately 91% of all wage and salary disbursements and 43% of personal income in the state (U.S. Bureau of Economic Analysis, 2011). Analysts have noted that "minerals related employment is one of the key predictors of sales and use tax revenue" in Wyoming (CREG 2010).
Despite the recent growth, overall employment remains approximately 9,600 jobs (3.3%) below its fourth quarter 2008 level. In other words, the state has yet to recoup the job losses of 2009 and 2010.
The covered payroll and employment data in this article are tabulated by place of work, in contrast to the labor force estimates which are a measure of employed and unemployed persons by place of residence. Also, the employment data presented in this article represent a count of jobs, not persons. When individuals work more than one job, each is counted separately. Finally, job growth (or decline) is stated in terms of net change. The Quarterly Turnover Statistics by Industry table presents alternative measures of job gains and losses using the same data sources and calculated to describe the components of change.
|
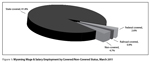
Figure 1 shows Wyoming wage & salary employment by covered/non-covered status. Approximately 92% of wage & salary jobs in the state are covered by state unemployment insurance, while 2.6% of jobs are covered by federal unemployment insurance, and 0.9% are covered by unemployment insurance administered by the railroad retirement board. There are several categories of non-covered jobs, and together they account for approximately 5% of wage & salary jobs in the state. Some examples of non-covered employment include elected officials, students working at educational institutions, employees of churches, and workers at small non-profit organizations.
The purpose of this article is to illustrate and describe employment and payroll changes between fourth quarter 2010 and fourth quarter 2011. These economic changes help gauge the overall strength of Wyoming's economy and identify the fastest and slowest growing sectors and geographic areas.
 |
 |
 |
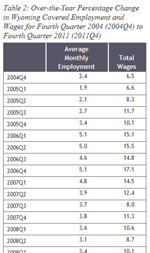
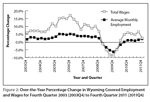
Job growth accelerated from 1.4% in third quarter to 2.0% in fourth quarter, but total payroll growth slowed from 6.5% to 2.5% (see Table 2). Figure 2 shows that in fourth quarter the growth rate of total payroll was at its lowest level since second quarter 2010. Total payroll decreased in many sectors, including utilities, construction, information, finance & insurance, management of companies & enterprises, and federal government. One possible explanation for a decrease in total payroll would be employers paying fewer (or smaller) bonuses in fourth quarter 2011 than a year earlier.
Employment and Wages by County
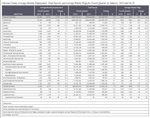
Employment increased in 14 counties and decreased in nine counties (see Table 3). Total payroll rose in 15 counties and fell in eight counties.
Sweetwater County gained 723 jobs (3.0%) and its total payroll grew by $12.6 million (3.8%). Strong growth was seen in mining (including oil & gas, more than 600 jobs), manufacturing (more than 100 jobs), and accommodation & food services (more than 100 jobs). Employment fell in construction (approximately 150 jobs).
Sublette County added 546 jobs (9.7%) and its total payroll rose by $8.7 million (10.3%). Mining gained more than 200 jobs, while construction gained approximately 100. Growth was also seen in transportation & warehousing and retail trade.
Park County employment increased by 405 jobs (3.2%) and its total payroll grew by $3.7 million (3.0%). Job gains were seen in accommodation & food services (more than 100 jobs), construction (approximately 100 jobs), and mining (including oil & gas; approximately 100 jobs).
Converse County gained 343 jobs (6.3%) and its total payroll increased by $4.3 million (7.1%). The largest job growth was seen in mining, accommodation & food services, and manufacturing. Smaller gains occurred in professional & technical services, transportation & warehousing, retail trade, and wholesale trade.
Employment in Teton County grew by 307 jobs (2.0%), but its total payroll fell by $1.6 million (-0.9%). Notable job gains occurred in construction; arts, entertainment, & recreation; and local government (including public schools & hospitals). Large decreases in total payroll were seen in wholesale trade (-$5.8 million) and management of companies & enterprises (-$2.7 million). These payroll declines were likely the result of bonuses paid in fourth quarter 2010, but not repeated in fourth quarter 2011.
Uinta County lost 565 jobs (-5.8%) and its total payroll fell by $20.8 million (-17.8%). Employment decreased by nearly 500 jobs in construction, and more than 100 jobs in mining (including oil & gas). Total payroll decreased by $13.3 million in construction, and $6.0 million in mining.
Employment in Campbell County fell by 391 jobs (-1.4%) and its total payroll decreased by $23.8 million (-5.6%). Large job losses in construction (approximately 1,250 jobs) were mostly offset by growth in mining (including oil & gas; nearly 500 jobs), administrative & waste services (approximately 150 jobs), wholesale trade (nearly 100 jobs), and other services (nearly 100 jobs). Construction payroll fell by $29.0 million.
Carbon County lost 124 jobs (-1.9%), but its total payroll increased by $4.4 million (6.4%). Modest job losses were seen in construction, agriculture, retail trade, and state government.
 |
 |
Natrona County gained 1,774 jobs (4.6%) and its total payroll increased by $32.6 million (7.0%). Strong growth occurred in mining (including oil & gas; 448 jobs, or 12.7%), accommodation & food services (253 jobs, or 7.2%), wholesale trade (216 jobs, or 9.1%), other services (184 jobs, or 10.3%), and manufacturing (169 jobs, or 10.1%).
Laramie County added 828 jobs (1.9%) and its total payroll grew by $10.1 million (2.3%). Job gains occurred in construction (289 jobs, or 11.6%), mining (including oil & gas; 121 jobs, or 180.6%), retail trade (121 jobs, or 2.2%), and accommodation & food services (117 jobs, or 2.9%). Job losses were seen in local government (-48 jobs, or 0.7%), federal government (-32 jobs, or 1.2%), and administrative & waste services (-22 jobs, or -1.3%).
Statewide Employment and Wages by Industry
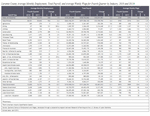
When viewed from an industry perspective, the largest job gains occurred in mining (including oil & gas), administrative & waste services, manufacturing, accommodation & food services, wholesale trade, and transportation & warehousing (see Table 4). Job losses were seen in construction, educational services, and federal government.
 |
Mining (including oil & gas) added 2,471 jobs (9.5%) and its total payroll grew by $51.4 million (9.6%). Oil & gas extraction gained nearly 200 jobs. Mining, except oil & gas gained more than 300 jobs and support activities for mining gained more than 1,950 jobs.
Administrative & waste services gained 707 jobs (9.8%) and its total payroll increased by $18.7 million (34.2%). Sizeable job gains occurred in employment services (including temporary help agencies; approximately 400 jobs) and services to buildings & dwellings (including janitorial services and landscaping services; more than 150 jobs).
Manufacturing employment increased by 617 jobs (6.8%) and its total payroll rose by $9.6 million (7.6%). Large job gains were seen in fabricated metal product manufacturing (more than 200 jobs), machinery manufacturing (approximately 150 jobs), and chemical manufacturing (approximately 100 jobs). It appears that some of the growth in manufacturing was associated with increased oil & gas activity.
Accommodation & food services added 539 jobs (1.9%) and its total payroll grew by $1.5 million (1.2%). The vast majority of new jobs (approximately 500) were found in food services & drinking places, while employment increased only slightly in accommodation.
Wholesale trade gained 477 jobs (5.6%) and its total payroll rose by $6.0 million (4.5%). This sector may be adding jobs in order to support expanding oil & gas activity.
Employment in transportation & warehousing increased by 402 jobs (4.4%) and its total payroll grew by $6.5 million (5.9%). Job growth was especially strong in truck transportation (nearly 400 jobs).
Construction employment fell by 404 jobs (-1.8%) and its total payroll decreased by $15.4 million (-5.1%). Heavy & civil engineering construction lost more than 400 jobs, construction of buildings added approximately 100 jobs, and specialty trade contractors lost nearly 100 jobs.
Educational services lost 164 jobs (-8.8%) and its total payroll fell by $0.7 million (-5.6%). Slight job growth was seen in elementary & secondary schools and colleges & universities, but employment fell in other schools & instruction.
Federal government employment fell by 120 jobs (-1.6%) and its total payroll decreased by $5.6 million (-4.8%). It appears that most of these job losses were associated with the completion of the decennial census.
In summary, overall job growth accelerated from previous quarters, but growth in total payroll slowed substantially. The slowdown in payroll growth may be related to fewer bonuses being paid in fourth quarter 2011 than a year earlier. A large part of overall job growth is either directly related to energy development, or indirectly related, in sectors such as manufacturing, wholesale trade, and transportation & warehousing.
References
Consensus Revenue Estimating Group (CREG). (2010, October). Wyoming state government revenue forecast fiscal year 2011-fiscal year 2016. Retrieved February 17, 2011, from http://eadiv.state.wy.us/creg/GreenCREG_Oct10.pdf
U.S. Bureau of Economic Analysis. (2011, March 16). SA04 State income and employment summary -- Wyoming. Retrieved March 16, 2011, from http://www.bea.gov/regional/spi/default.cfm