
Economic Indicators
Total nonfarm employment increased to 289,100 in May, a gain of 1.5% from its May 2010 level.
| May | April | May | Percent Change | ||
|---|---|---|---|---|---|
| 2011 | 2011 | 2010 | Month | Year | |
| (p) | (r) | (b) | |||
| Wyoming Total Nonfarm Employment | 289,100 | 279,700 | 284,800 | 3.4 | 1.5 |
| Wyoming State Government | 17,500 | 17,400 | 17,100 | 0.6 | 2.3 |
| Laramie County Nonfarm Employment | 43,500 | 43,500 | 43,600 | 0.0 | -0.2 |
| Natrona County Nonfarm Employment | 39,500 | 38,500 | 38,600 | 2.6 | 2.3 |
| Selected U.S. Employment Data | |||||
| U.S. Multiple Jobholders | 7,084,000 | 6,887,000 | 7,261,000 | 2.9 | -2.4 |
| As a percent of all workers | 5.1% | 4.9% | 5.2% | N/A | N/A |
| U.S. Discouraged Workers | 822,000 | 989,000 | 1,083,000 | -16.9 | -24.1 |
| U.S. Part Time for Economic Reasons | 8,270,000 | 8,425,000 | 8,513,000 | -1.8 | -2.9 |
| Wyoming Unemployment Insurance | |||||
| Weeks Compensated | 23,800 | 27,339 | 32,116 | -12.9 | -25.9 |
| Benefits Paid | $7,643,865 | $8,781,163 | $10,668,445 | -13.0 | -28.4 |
| Average Weekly Benefit Payment | $321.17 | $321.20 | $332.18 | 0.0 | -3.3 |
| State Insured Covered Jobs1 | 261,032 | 254,075 | 258,914 | 2.7 | 0.8 |
| Insured Unemployment Rate | 2.5% | 2.9% | 3.4% | N/A | N/A |
| Consumer Price Index (U) for All U.S. Urban Consumers | |||||
| (1982 to 1984 = 100) | |||||
| All Items | 226.0 | 224.9 | 218.2 | 0.5 | 3.6 |
| Food & Beverages | 227.1 | 226.2 | 219.7 | 0.4 | 3.4 |
| Housing | 218.5 | 217.9 | 216.0 | 0.3 | 1.2 |
| Apparel | 122.3 | 122.2 | 121.0 | 0.1 | 1.0 |
| Transportation | 220.3 | 216.9 | 194.8 | 1.6 | 13.1 |
| Medical Care | 399.4 | 398.8 | 387.8 | 0.1 | 3.0 |
| Recreation (Dec. 1997=100) | 113.7 | 113.4 | 113.7 | 0.2 | 0.0 |
| Education & Comm. (Dec. 1997=100) | 130.6 | 130.6 | 129.3 | 0.0 | 1.0 |
| Other Goods & Services | 385.5 | 386.2 | 379.7 | -0.2 | 1.5 |
| Producer Prices (1982 to 1984 = 100) | |||||
| All Commodities | 204.2 | 202.8 | 184.8 | 0.7 | 10.5 |
| Wyoming Building Permits (New Privately Owned Housing Units Authorized) | |||||
| Total Units | 150 | 152 | 160 | -1.3 | -6.3 |
| Valuation | $40,641,000 | $38,594,000 | $32,593,000 | 5.3 | 24.7 |
| Single Family Homes | 137 | 142 | 107 | -3.5 | 28.0 |
| Valuation | $39,820,000 | $37,616,000 | $25,485,000 | 5.9 | 56.2 |
| Casper MSA2 Building Permits | 11 | 17 | 14 | -35.3 | -21.4 |
| Valuation | $1,355,000 | $2,605,000 | $2,336,000 | -48.0 | -42.0 |
| Cheyenne MSA Building Permits | 31 | 16 | 10 | 93.8 | 210.0 |
| Valuation | $4,690,000 | $2,876,000 | $1,793,000 | 63.1 | 161.6 |
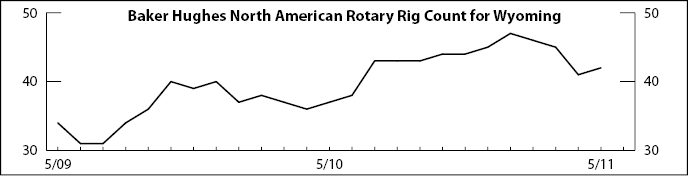
| Baker Hughes North American Rotary Rig Count for Wyoming | 42 | 41 | 37 | 2.4 | 13.5 |
|
|||||
| (p) Preliminary. (r) Revised. (b) Benchmarked. | |||||
| 1Local Area Unemployment Statistics Program Estimates. | |||||
| 2Metropolitan Statistical Area. | |||||