
Wyoming Normalizeda Unemployment Insurance Statistics: Initial Claims
May's statewide initial claims total was 30.9% less than in April and 19.9% less than in May of last year. The 30.9% over-the-month decline was the largest on a percentage basis since May 2007.
| Claims Filed | Percent Change | Difference | ||||
|---|---|---|---|---|---|---|
| May 11 | May 11 | May 11 | ||||
| May 11 | Apr 11 | May 10 | Apr 11 | May 10 | May 10 | |
| Wyoming Statewide | ||||||
| Total | 2,923 | 4,229 | 3,647 | -30.9 | -19.9 | -724 |
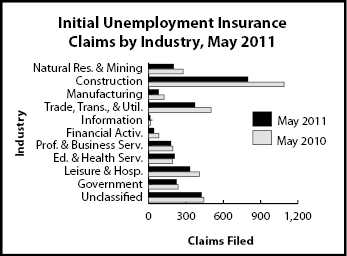
| Goods-Producing | 1,079 | 1,270 | 1,492 | -15.0 | -27.7 | -413 |
| Natural Resources & Mining | 201 | 267 | 278 | -24.7 | -27.7 | -77 |
| Mining | 187 | 242 | 252 | -22.7 | -25.8 | -65 |
| Oil & Gas Extraction | 9 | 13 | 13 | -30.8 | -30.8 | -4 |
| Construction | 798 | 893 | 1,090 | -10.6 | -26.8 | -292 |
| Manufacturing | 80 | 110 | 124 | -27.3 | -35.5 | -44 |
| Service-Providing | 1,198 | 2,250 | 1,475 | -46.8 | -18.8 | -277 |
| Trade, Transp., & Utilities | 371 | 500 | 503 | -25.8 | -26.2 | -132 |
| Wholesale Trade | 51 | 54 | 124 | -5.6 | -58.9 | -73 |
| Retail Trade | 209 | 278 | 251 | -24.8 | -16.7 | -42 |
| Transp., Warehousing & Utilities | 111 | 168 | 128 | -33.9 | -13.3 | -17 |
| Information | 12 | 21 | 16 | -42.9 | -25.0 | -4 |
| Financial Activities | 43 | 55 | 83 | -21.8 | -48.2 | -40 |
| Prof. & Business Services | 178 | 204 | 195 | -12.7 | -8.7 | -17 |
| Educational & Health Services | 209 | 169 | 191 | 23.7 | 9.4 | 18 |
| Leisure & Hospitality | 331 | 1,222 | 408 | -72.9 | -18.9 | -77 |
| Other Services, except Public Admin. | 54 | 79 | 79 | -31.6 | -31.6 | -25 |
| Government | 222 | 222 | 236 | 0.0 | -5.9 | -14 |
| Federal Government | 49 | 87 | 82 | -43.7 | -40.2 | -33 |
| State Government | 23 | 27 | 18 | -14.8 | 27.8 | 5 |
| Local Government | 150 | 108 | 136 | 38.9 | 10.3 | 14 |
| Local Education | 53 | 24 | 39 | 120.8 | 35.9 | 14 |
| Unclassified | 424 | 487 | 444 | -12.9 | -4.5 | -20 |
| Laramie County | ||||||
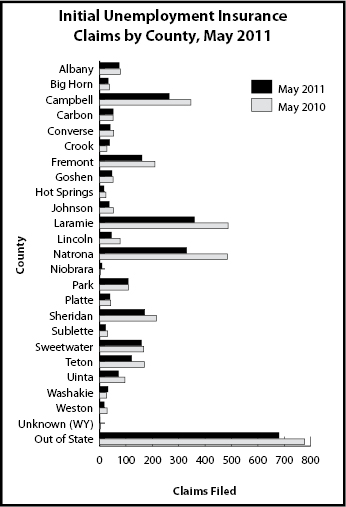
| Total | 356 | 355 | 486 | 0.3 | -26.7 | -130 |
| Goods-Producing | 115 | 134 | 196 | -14.2 | -41.3 | -81 |
| Construction | 107 | 122 | 173 | -12.3 | -38.2 | -66 |
| Service-Providing | 191 | 171 | 238 | 11.7 | -19.7 | -47 |
| Trade, Transp., & Utilities | 65 | 61 | 76 | 6.6 | -14.5 | -11 |
| Financial Activities | 8 | 9 | 14 | -11.1 | -42.9 | -6 |
| Prof. & Business Services | 28 | 27 | 31 | 3.7 | -9.7 | -3 |
| Educational & Health Services | 45 | 37 | 37 | 21.6 | 21.6 | 8 |
| Leisure & Hospitality | 34 | 27 | 63 | 25.9 | -46.0 | -29 |
| Government | 35 | 31 | 34 | 12.9 | 2.9 | 1 |
| Unclassified | 15 | 19 | 18 | -21.1 | -16.7 | -3 |
| Natrona County | ||||||
| Total | 327 | 343 | 482 | -4.7 | -32.2 | -155 |
| Goods-Producing | 105 | 119 | 207 | -11.8 | -49.3 | -102 |
| Construction | 67 | 82 | 161 | -18.3 | -58.4 | -94 |
| Service-Providing | 197 | 195 | 261 | 1.0 | -24.5 | -64 |
| Trade, Transp., & Utilities | 77 | 57 | 104 | 35.1 | -26.0 | -27 |
| Financial Activities | 7 | 6 | 14 | 16.7 | -50.0 | -7 |
| Prof. & Business Services | 26 | 39 | 36 | -33.3 | -27.8 | -10 |
| Educational & Health Services | 32 | 34 | 38 | -5.9 | -15.8 | -6 |
| Leisure & Hospitality | 42 | 37 | 54 | 13.5 | -22.2 | -12 |
| Government | 11 | 13 | 9 | -15.4 | 22.2 | 2 |
| Unclassified | 14 | 16 | 5 | -12.5 | 180.0 | 9 |
|
||||||
aAn average month is considered 4.33 weeks. If a month has four weeks, the normalization factor is 1.0825. If the month has five weeks, the normalization factor is 0.866. The number of raw claims is multiplied by the normalization factor to achieve the normalized claims counts.