
Wyoming Occupational Fatalities Rise in 2010
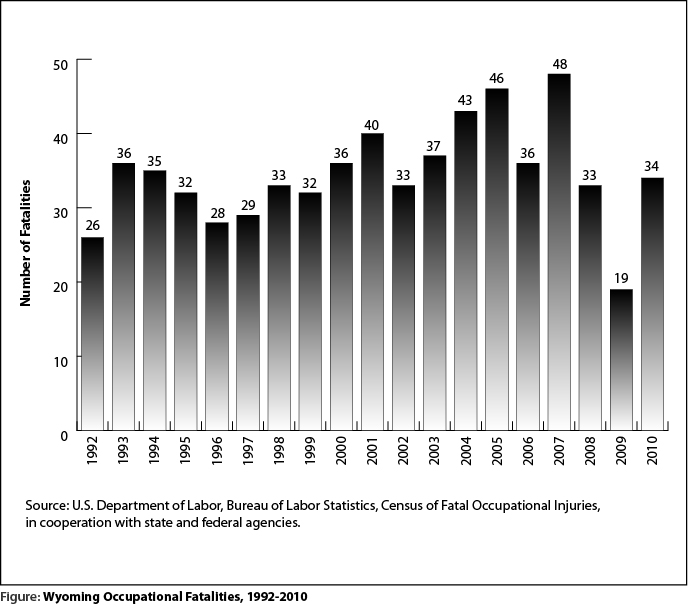
Wyoming occupational fatalities increased from 19 in 2009 to 34 in 2010, an increase of 78.9% (see Figure).
From 1992 to 2010, an average of 35 people died on the job in Wyoming in a given year. While 2009 fatalities were much lower than this average, the 2010 fatalities were more consistent with other years. The rise in deaths from 2009 to 2010 was associated with a 63.6% increase in transportation accidents.
Natural resources & mining had the most fatalities with 10, or 29.4% of all deaths (see Table 1). The remainder of deaths were spread out across other industries, including trade, transportation, & utilities (6); construction (5); and other services, except public administration (4).
More than half of all fatalities (52.9%) were the result of transportation accidents, a result similar to other years.
Transportation accidents are the most common cause of work-related deaths. From 2003 to 2010, 296 people died while on the job (see Table 2). Of that total, 61.5% (182) resulted from transportation accidents. Nearly one-third of all deaths during this time occurred in natural resources & mining (31.4%), followed by trade, transportation, & utilities (28.4%).
Variations from year to year are, to some extent, the result of the random nature of work-related accidents. The only events that show a consistent pattern in Wyoming are transportation events, highway accidents in particular.
For more information on occupational fatalities, go to http://doe.state.wy.us/LMI/cfoi/toc.htm.
| Total | Transportation Accidentsa | |||
|---|---|---|---|---|
| Industry | Number | Col. % | Number | Row % |
| Natural Resources & Mining | 10 | 29.4% | 3 | 30.0% |
| Construction | 5 | 14.7% | 3 | 60.0% |
| Trade, Transportation, & Utilities | 6 | 17.6% | 4 | 66.7% |
| Other Services, except Public Admin. | 4 | 11.8% | 4 | 100.0% |
| All Other Industries | 9 | 26.5% | 4 | 44.4% |
| Total | 34 | 100.0% | 18 | 52.9% |
| aTransportation accidents involve transportation vehicles, powered industrial vehicles or powered mobile industrial equipment in which at least one vehicle (or mobile equipment) is in normal operation and the injury/illness was due to collision or other type of traffic accident regardless of the location where the event occurred. Examples of vehicles included are airplanes, trucks, forklifts, and all-terrain vehicles. | ||||
| ND — Not disclosable due to confidentiality of information. | ||||
| Source: U.S. Department of Labor, Bureau of Labor Statistics, in cooperation with state and federal agencies, Census of Fatal Occupational Injuries. | ||||
| Total | Transportation Accidentsa | |||
|---|---|---|---|---|
| Industry | Number | Col. % | Number | Row % |
| Natural Resources & Mining | 93 | 31.4% | 39 | 41.9% |
| Construction | 44 | 14.9% | 25 | 56.8% |
| Manufacturing | 7 | 2.4% | 3 | 42.9% |
| Trade, Transportation, & Utilities | 84 | 28.4% | 69 | 82.1% |
| Transportation & Warehousing | 64 | 21.6% | 55 | 85.9% |
| Financial Activities | 4 | 1.4% | 3 | 75.0% |
| Professional & Business Services | 15 | 5.1% | 10 | 66.7% |
| Leisure & Hospitality | 13 | 4.4% | 6 | 46.2% |
| Other Services exc. Public Administration | 10 | 3.4% | 8 | 80.0% |
| Public Administration | 20 | 6.8% | 14 | 70.0% |
| All Other Industries | 6 | 2.0% | 5 | 83.3% |
| Total Fatalities, 2003-2010 | 296 | 100.0% | 182 | 61.5% |
| aTransportation accidents involve transportation vehicles, powered industrial vehicles or powered mobile industrial equipment in which at least one vehicle (or mobile equipment) is in normal operation and the injury/illness was due to collision or other type of traffic accident regardless of the location where the event occurred. Examples of vehicles included are airplanes, trucks, forklifts, and all-terrain vehicles. | ||||
| Source: U.S. Department of Labor, Bureau of Labor Statistics, in cooperation with state and federal agencies, Census of Fatal Occupational Injuries. | ||||