Gender Wage Gap Stays Near 60% for Third Straight Year in 2013 (Tables and Figures)
by: Michele Holmes, Public Relations Specialist
See Related Article
Table 1, 2
Figure 1, 2

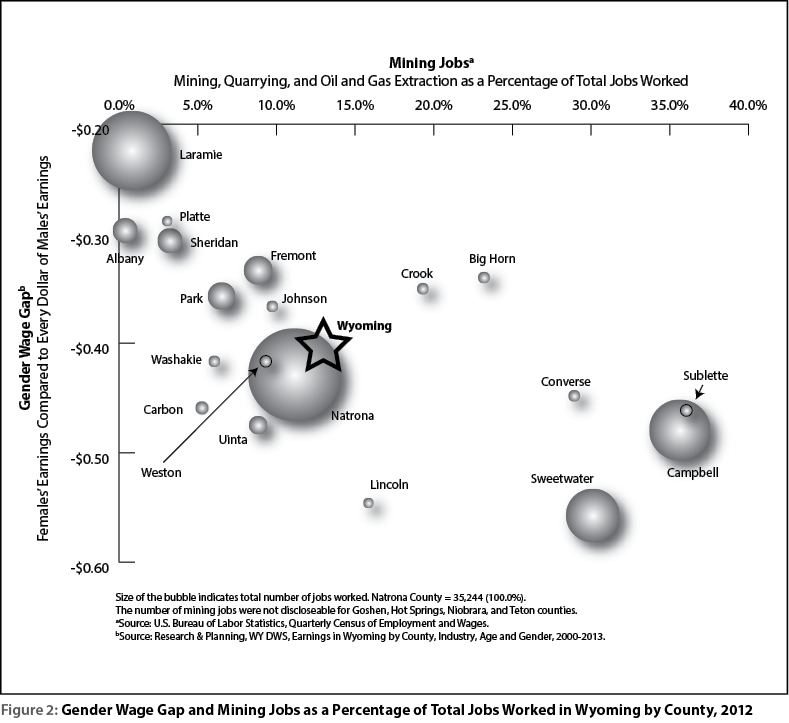
Table 1: Total Number of Persons Working At Any Time and Average Annual Wages in Wyoming by Gender and Industry, 2013
|
Industry
|
Employment
|
Earnings
|
|
Total
|
Females
|
Males
|
Nonresidents
|
Gender
|
Wage Gap
|
|
N
|
%
|
N
|
%
|
N
|
%
|
N
|
%
|
Females
|
Males
|
Difference
|
%a |
|
Total, All Industries
|
362,418
|
100.0%
|
140,596
|
38.8%
|
171,106
|
47.2%
|
50,716
|
14.0%
|
$26,563
|
$44,125
|
-$17,563
|
60.2%
|
|
Natural Resources & Mining
|
36,973
|
100.0%
|
3,952
|
10.7%
|
28,000
|
75.7%
|
5,021
|
13.6%
|
$45,350
|
$67,702
|
-$22,352
|
67.0%
|
|
Construction
|
39,331
|
100.0%
|
3,150
|
8.0%
|
24,944
|
63.4%
|
11,237
|
28.6%
|
$25,306
|
$32,224
|
-$6,918
|
78.5%
|
|
Manufacturing
|
11,967
|
100.0%
|
2,237
|
18.7%
|
8,731
|
73.0%
|
999
|
8.3%
|
$29,409
|
$54,394
|
-$24,985
|
54.1%
|
|
Wholesale Trade, Trans., & Utilities |
25,521
|
100.0%
|
4,969
|
19.5%
|
18,429
|
72.2%
|
2,123
|
8.3%
|
$31,428
|
$53,189
|
-$21,762
|
59.1%
|
|
Retail Trade
|
40,609
|
100.0%
|
19,168
|
47.2%
|
16,745
|
41.2%
|
4,696
|
11.6%
|
$17,136
|
$27,293
|
-$10,157
|
62.8%
|
|
Information
|
5,051
|
100.0%
|
2,219
|
43.9%
|
2,509
|
49.7%
|
323
|
6.4%
|
$26,863
|
$44,086
|
-$17,223
|
60.9%
|
|
Financial Activities
|
13,184
|
100.0%
|
7,639
|
57.9%
|
4,670
|
35.4%
|
875
|
6.6%
|
$33,527
|
$62,727
|
-$29,200
|
53.4%
|
|
Professional & Business Services
|
26,904
|
100.0%
|
9,417
|
35.0%
|
13,232
|
49.2%
|
4,255
|
15.8%
|
$27,106
|
$44,094
|
-$16,988
|
61.5%
|
|
Educational Services
|
33,652
|
100.0%
|
21,560
|
64.1%
|
10,282
|
30.6%
|
1,810
|
5.4%
|
$33,926
|
$43,319
|
-$9,393
|
78.3%
|
|
Health Care & Social Assistance
|
37,027
|
100.0%
|
28,392
|
76.7%
|
6,669
|
18.0%
|
1,966
|
5.3%
|
$31,670
|
$68,118
|
-$36,448
|
46.5%
|
|
Leisure & Hospitality
|
55,792
|
100.0%
|
22,824
|
40.9%
|
17,995
|
32.3%
|
14,973
|
26.8%
|
$11,270
|
$14,637
|
-$3,367
|
77.0%
|
|
Other Services Exc. Public Admin.
|
11,023
|
100.0%
|
4,288
|
38.9%
|
5,259
|
47.7%
|
1,476
|
13.4%
|
$20,688
|
$37,123
|
-$16,435
|
55.7%
|
|
Public Administration
|
24,344
|
100.0%
|
10,471
|
43.0%
|
13,180
|
54.1%
|
693
|
2.8%
|
$35,604
|
$44,123
|
-$8,519
|
80.7%
|
|
Nonclassified Industry
|
1,040
|
100.0%
|
310
|
29.8%
|
461
|
44.3%
|
269
|
25.9%
|
$15,802
|
$25,265
|
-$9,463
|
62.5%
|
|
|
| a% = Females' earnings as a percentage of males' earnings.
|
Table 2: Total Number of Persons Working At Any Time and Average Annual Wages in Wyoming by Gender and County, 2013
|
|
Employment
|
Earnings
|
|
|
Total
|
Females
|
Males
|
Nonresidents
|
Gender
|
Wage Gap
|
|
County
|
N
|
%
|
N
|
%
|
N
|
%
|
N
|
%
|
Females
|
Males
|
Difference
|
%a |
|
Wyoming
|
362,418
|
100.0%
|
140,596
|
38.8%
|
171,106
|
47.2%
|
50,716
|
14.0%
|
$26,563
|
$44,125
|
-$17,562
|
60.2%
|
|
Albany
|
17,990
|
100.0%
|
7,884
|
43.8%
|
8,408
|
46.7%
|
1,698
|
9.4%
|
$26,673
|
$36,829
|
-$10,156
|
72.4%
|
|
Big Horn
|
5,188
|
100.0%
|
2,095
|
40.4%
|
2,653
|
51.1%
|
440
|
8.5%
|
$24,252
|
$37,587
|
-$13,335
|
64.5%
|
|
Campbell
|
33,300
|
100.0%
|
12,120
|
36.4%
|
18,425
|
55.3%
|
2,755
|
8.3%
|
$30,494
|
$59,150
|
-$28,656
|
51.6%
|
|
Carbon
|
8,329
|
100.0%
|
3,367
|
40.4%
|
3,886
|
46.7%
|
1,076
|
12.9%
|
$24,161
|
$43,873
|
-$19,712
|
55.1%
|
|
Converse
|
7,083
|
100.0%
|
3,013
|
42.5%
|
3,407
|
48.1%
|
663
|
9.4%
|
$24,615
|
$43,831
|
-$19,216
|
56.2%
|
|
Crook
|
2,630
|
100.0%
|
1,184
|
45.0%
|
1,138
|
43.3%
|
308
|
11.7%
|
$22,906
|
$35,944
|
-$13,038
|
63.7%
|
|
Fremont
|
21,071
|
100.0%
|
9,570
|
45.4%
|
9,584
|
45.5%
|
1,917
|
9.1%
|
$25,145
|
$37,092
|
-$11,947
|
67.8%
|
|
Goshen
|
5,450
|
100.0%
|
2,584
|
47.4%
|
2,425
|
44.5%
|
441
|
8.1%
|
$23,617
|
$31,883
|
-$8,266
|
74.1%
|
|
Hot Springs
|
2,615
|
100.0%
|
1,234
|
47.2%
|
1,166
|
44.6%
|
215
|
8.2%
|
$22,435
|
$37,871
|
-$15,436
|
59.2%
|
|
Johnson
|
4,309
|
100.0%
|
1,839
|
42.7%
|
1,973
|
45.8%
|
497
|
11.5%
|
$22,365
|
$33,823
|
-$11,458
|
66.1%
|
|
Laramie
|
53,937
|
100.0%
|
23,721
|
44.0%
|
25,580
|
47.4%
|
4,636
|
8.6%
|
$28,572
|
$36,825
|
-$8,253
|
77.6%
|
|
Lincoln
|
6,610
|
100.0%
|
2,891
|
43.7%
|
3,121
|
47.2%
|
598
|
9.0%
|
$21,173
|
$43,684
|
-$22,511
|
48.5%
|
|
Natrona
|
51,206
|
100.0%
|
20,736
|
40.5%
|
26,253
|
51.3%
|
4,217
|
8.2%
|
$27,974
|
$49,241
|
-$21,267
|
56.8%
|
|
Niobrara
|
1,092
|
100.0%
|
587
|
53.8%
|
434
|
39.7%
|
71
|
6.5%
|
$23,035
|
$29,347
|
-$6,312
|
78.5%
|
|
Park
|
15,827
|
100.0%
|
7,091
|
44.8%
|
6,998
|
44.2%
|
1,738
|
11.0%
|
$24,510
|
$38,485
|
-$13,975
|
63.7%
|
|
Platte
|
4,135
|
100.0%
|
1,825
|
44.1%
|
1,850
|
44.7%
|
460
|
11.1%
|
$22,285
|
$31,808
|
-$9,523
|
70.1%
|
|
Sheridan
|
15,270
|
100.0%
|
7,026
|
46.0%
|
6,827
|
44.7%
|
1,417
|
9.3%
|
$25,534
|
$37,301
|
-$11,767
|
68.5%
|
|
Sublette
|
7,040
|
100.0%
|
2,052
|
29.1%
|
3,573
|
50.8%
|
1,415
|
20.1%
|
$29,364
|
$59,143
|
-$29,779
|
49.6%
|
|
Sweetwater
|
29,554
|
100.0%
|
10,515
|
35.6%
|
16,112
|
54.5%
|
2,927
|
9.9%
|
$28,235
|
$59,361
|
-$31,126
|
47.6%
|
|
Teton
|
24,743
|
100.0%
|
7,779
|
31.4%
|
10,116
|
40.9%
|
6,848
|
27.7%
|
$28,048
|
$35,495
|
-$7,447
|
79.0%
|
|
Uinta
|
11,300
|
100.0%
|
4,775
|
42.3%
|
5,100
|
45.1%
|
1,425
|
12.6%
|
$22,762
|
$43,327
|
-$20,565
|
52.5%
|
|
Washakie
|
4,722
|
100.0%
|
1,979
|
41.9%
|
2,292
|
48.5%
|
451
|
9.6%
|
$22,863
|
$38,313
|
-$15,450
|
59.7%
|
|
Weston
|
2,784
|
100.0%
|
1,339
|
48.1%
|
1,254
|
45.0%
|
191
|
6.9%
|
$22,168
|
$37,917
|
-$15,749
|
58.5%
|
|
Unspecified
|
26,233
|
100.0%
|
3,390
|
12.9%
|
8,531
|
32.5%
|
14,312
|
54.6%
|
$19,305
|
$34,781
|
-$15,476
|
55.5%
|
|
|
| a% = Females’ earnings as a percentage of males’ earnings. |