
Local Jobs and Payroll in Wyoming: Large Job Gains in Oil & Gas and Related Sectors in Third Quarter 2011
Related Tables and Figures
Wyoming’s mining sector (including oil & gas) added the largest number of new jobs in third quarter 2011, and much of the growth in other sectors appeared related to oil & gas.
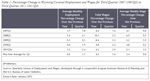 |
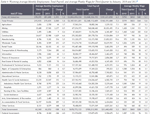
Total unemployment insurance (UI) covered payroll increased by $181.6 million (6.3%) in third quarter 2011. Employment rose by 3,393 jobs (1.2%) and average weekly wage increased by $40 (5.1%). These increases are all higher than their five-year averages (see Table 1). In terms of dollars, UI covered payroll represents approximately 91% of all wage and salary disbursements and 43% of personal income in the state (U.S. Bureau of Economic Analysis, 2011). Analysts have noted that “minerals related employment is one of the key predictors of sales and use tax revenue” in Wyoming (CREG 2010).
The covered payroll and employment data in this article are tabulated by place of work, in contrast to the labor force estimates, which are a measure of employed and unemployed persons by place of residence. Also, the employment data presented in this article represent a count of jobs, not persons. When individuals work more than one job, each is counted separately. Finally, job growth (or decline) is stated in terms of net change. The Quarterly Turnover Statistics by Industry table presents alternative measures of job gains and losses using the same data sources and calculated to describe the components of change.
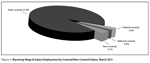 |
Figure 1 shows Wyoming wage & salary employment by covered/non-covered status. Approximately 92% of wage & salary jobs in the state are covered by state unemployment insurance, while 2.6% of jobs are covered by federal unemployment insurance, and 0.9% are covered by unemployment insurance administered by the railroad retirement board. There are several categories of non-covered jobs, and together they account for approximately 5% of wage & salary jobs in the state. Some examples of non-covered employment include elected officials, students working at educational institutions, employees of churches, and workers at small non-profit organizations.
The purpose of this article is to illustrate and describe employment and payroll changes between third quarter 2010 and third quarter 2011. These economic changes help gauge the overall strength of Wyoming’s economy and identify the fastest and slowest growing sectors and geographic areas.
 |
 |
 |
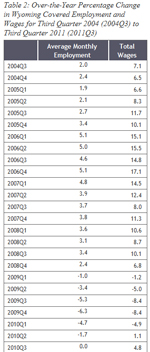
Third quarter 2011 was the sixth consecutive quarter of growth in total payroll. Increases in total payroll have been fairly stable for the past four quarters, ranging from 4.7% to 6.3% (see Table 2). However, total payroll growth remains at approximately one-third to one-half of the level that prevailed during much of 2006-2008.
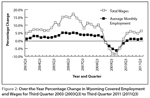
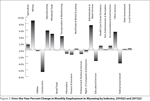
Job growth, although only marginally faster than in the three previous quarters, rose at its fastest pace since fourth quarter 2008 (see Figure 2).
Employment and Wages by County
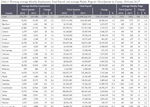
Employment increased in 13 counties and decreased in 10 counties (see Table 3). Total payroll increased in all but two counties.
Sweetwater County added 1,038 jobs (4.3%) and its total payroll increased by $44.8 million (15.3%). The largest job gains occurred in mining (including oil & gas; approximately 650 jobs). Growth was also seen in accommodation & food services (more than 100 jobs), construction (more than 100 jobs), and transportation & warehousing (approximately 100 jobs).
Employment in Sublette County increased by 414 jobs (7.0%) and its total payroll rose by $11.0 million (13.5%). Mining (including oil & gas) added more than 200 jobs, while smaller gains were seen in transportation & warehousing; real estate, rental & leasing; and administrative & waste services.
Park County employment grew by 343 jobs (2.3%) and its total payroll increased by $7.3 million (5.7%). Job growth occurred in accommodation & food services (nearly 150 jobs), construction (more than 100 jobs), and mining (including oil & gas; approximately 100 jobs).
Albany County added 335 jobs (2.2%) and its total payroll rose by $6.5 million (4.7%). Health care & social assistance posted the largest job gains (more than 100 jobs), while growth was also seen in accommodation & food services (approximately 100 jobs), and administrative & waste services (more than 50 jobs).
Teton County gained 175 jobs (0.9%) and its total payroll increased by $3.6 million (2.0%). Accommodation & food services added approximately 100 jobs and construction added more than 50 jobs. Employment decreased slightly in federal government, professional & technical services, and transportation.
Campbell County lost 781 jobs (-2.8%) and its total payroll fell by $1.7 million (-0.5%). Employment fell by approximately 1,600 jobs in construction and approximately 100 jobs in professional & technical services. However, job gains were seen in mining (including oil & gas; approximately 300 jobs), wholesale trade (approximately 100 jobs), administrative & waste services (approximately 100 jobs), and other services (approximately 100 jobs).
Uinta County’s employment fell by 737 jobs (-7.6%) and its total payroll decreased by $9.0 million (-9.0%). Nearly 600 jobs were lost in construction and nearly 200 in mining (including oil & gas). Employment increased modestly in manufacturing and wholesale trade.
Lincoln County lost 96 jobs (-1.6%), but its total payroll increased by $4.6 million (7.8%). Job gains in construction (approximately 100 jobs) were more than offset by small job losses in local government, retail trade, manufacturing, administrative & waste services, and federal government.
Sheridan County lost 78 jobs (-0.6%), but its total payroll grew by $2.1 million (1.8%). Job losses in construction, accommodation & food services, and professional & technical services more than offset job gains in manufacturing, health care, and other services.
|
Employment in Natrona County grew by 1,550 jobs (4.0%) and its total payroll rose by $28.8 million. Mining (including oil & gas) posted the largest job gains (631 jobs, or 19.0%). Job growth was also seen in wholesale trade (200 jobs, or 8.7%), other services (184 jobs, or 10.5%), manufacturing (166 jobs, or 10.4%), and accommodation & food services (152 jobs, or 4.2%). The largest job losses occurred in federal government (-55 jobs, or -7.2%).
|
Laramie County added 558 jobs (1.3%) and its total payroll rose by $37.3 million (8.9%). The largest job gains occurred in retail trade (181 jobs, or 3.5%), mining (including oil & gas; 106 jobs, or 186.0%), transportation & warehousing (88 jobs, or 3.9%), and construction (88 jobs, or 3.1%). Employment decreased slightly in state government (-19 jobs, or -0.5%), management of companies & enterprises (-17 jobs, or -23.0%), federal government (-16 jobs, or -0.6%), and local government (-12 jobs, or -0.2%).
Statewide Employment and Wages by Industry
 |
 |
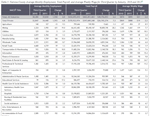
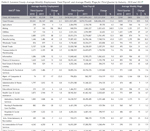
When viewed from an industry perspective, the largest job gains occurred in mining (including oil & gas), administrative & waste services, and manufacturing (see Table 4 and Figure 3). Smaller job gains were seen in accommodation & food services, other services, wholesale trade, and transportation & warehousing. Construction employment continued to fall, as did employment in federal government, professional & technical services, and finance & insurance.
Mining employment grew by 2,277 jobs (8.9%), and its total payroll rose by $83.0 million (17.4%). Oil & gas extraction added approximately 200 jobs. Mining, except oil & gas, added nearly 200 jobs, and support activities for mining added nearly 1,900 jobs.
Administrative & waste services gained 620 jobs (7.5%) and its total payroll grew by $7.8 million (13.4%). Employment services (including temporary help agencies) added more than 350 jobs and services to building & dwellings (including janitorial services and landscaping services) added nearly 200 jobs.
Manufacturing gained 516 jobs (5.9%) and its total payroll increased by $21.9 million (19.6%). Fabricated metal product manufacturing added more than 200 jobs, chemical manufacturing added more than 100 jobs, and machinery manufacturing added nearly 100 jobs. It appears that some of the growth in manufacturing was associated with increased oil & gas activity in the state.
Employment in accommodation & food services grew by 459 jobs (1.3%) and its total payroll rose by $6.4 million (4.3%). Food services & drinking places gained nearly 300 jobs, while accommodation gained more than 150 jobs.
Other services added 448 jobs (5.5%), but its total payroll decreased by $4.8 million (-6.2%). Repair & maintenance services gained more than 400 jobs and this growth was likely related to increased oil & gas activity. Employment fell slightly in civic & social organizations.
Employment in wholesale trade rose by 413 jobs (4.9%) and its total payroll increased by $10.6 million (9.4%). Industrial machinery & equipment merchant wholesalers added approximately 200 jobs. This sector may be adding jobs in order to support expanding oil & gas activity.
Employment continued to grow in transportation & warehousing (385 jobs, or 4.2%) and its total payroll rose by $11.6 million (11.2%). It seems that many of the job gains in truck transportation (nearly 450 jobs) were associated with increased oil & gas activity in the state.
By far the largest job losses were in the construction sector, where employment fell by 1,629 jobs (-6.6%) and total payroll decreased by $11.5 million (-3.9%). Employment in oil & gas pipelines & related structures construction fell by approximately 700 jobs.
Employment in federal government decreased by 346 jobs (-4.0%), but its total payroll rose by $5.9 million (5.2%). It appeared that most of these job losses were associated with the completion of the decennial census.
Professional & technical services lost 112 jobs (-1.2%), but its total payroll grew by $4.3 million (3.6%). Employment fell by approximately 200 jobs in architectural, engineering, & related services, but rose by more than 100 jobs in management & technical consulting services.
Employment continued to decline in finance & insurance, which lost 97 jobs (-1.4%). Modest job losses were seen in credit intermediation & related activities, and insurance carriers & related activities.
In summary, overall job growth continued at a modest pace. However, large job gains were seen in mining (including oil & gas), and in several related sectors, such as wholesale trade, manufacturing, transportation & warehousing, and other services.
References
Consensus Revenue Estimating Group (CREG). (2010, October). Wyoming state government revenue forecast fiscal year 2011-fiscal year 2016. Retrieved February 17, 2011 from http://eadiv.state.wy.us/creg/GreenCREG_Oct10.pdf
U.S. Bureau of Economic Analysis. (2011, March 16). SA04 State income and employment summary — Wyoming. Retrieved March 16, 2011, from http://www.bea.gov/regional/spi/default.cfm