Economic Indicators
by: Margaret Hiatt, Administrative/Survey Support Specialist
|
|
Jan
2012 (p)
|
Dec
2011 (r)
|
Jan
2011 (b)
|
Percent Change
|
|
Month
|
Year
|
|
Wyoming Total Nonfarm Employment
|
277,200
|
284,600
|
273,900
|
-2.6
|
1.2
|
|
|
Wyoming State Government
|
16,800
|
17,400
|
16,700
|
-3.4
|
0.6
|
|
Laramie County Nonfarm Employment
|
44,300
|
44,900
|
42,600
|
-1.3
|
4.0
|
|
Natrona County Nonfarm Employment
|
40,400
|
41,100
|
38,100
|
-1.7
|
6.0
|
|
|
|
|
|
|
|
|
Selected U.S. Employment Data
|
|
U.S. Multiple Jobholders
|
6,830,000
|
7,030,000
|
6,621,000
|
-2.8
|
3.2
|
|
|
As a percent of all workers
|
4.9%
|
5.0%
|
4.8%
|
N/A
|
N/A
|
|
U.S. Discouraged Workers
|
1,059,000
|
945,000
|
993,000
|
12.1
|
6.6
|
|
U.S. Part Time for Economic Reasons
|
8,918,000
|
8,428,000
|
9,187,000
|
5.8
|
-2.9
|
|
|
|
|
|
|
|
|
|
|
Wyoming Unemployment Insurance
|
|
|
Weeks Compensated
|
31,190
|
23,863
|
32,494
|
30.7
|
-4.0
|
|
|
Benefits Paid
|
$10,313,370
|
$7,598,131
|
$10,395,251
|
35.7
|
-0.8
|
|
|
Average Weekly Benefit Payment
|
$330.66
|
$318.41
|
$319.91
|
3.8
|
3.4
|
|
|
State Insured Covered Jobs1 |
259,901
|
263,575
|
251,256
|
-1.4
|
3.4
|
|
|
Insured Unemployment Rate
|
3.5%
|
3.1%
|
3.4%
|
N/A
|
N/A
|
|
|
|
|
|
|
|
|
|
|
Consumer Price Index (U) for All U.S. Urban Consumers
|
|
(1982 to 1984 = 100)
|
|
|
|
|
|
|
|
All Items
|
226.7
|
225.7
|
220.2
|
0.4
|
2.9
|
|
|
|
Food & Beverages
|
232.6
|
231.1
|
223.2
|
0.6
|
4.2
|
|
|
|
Housing
|
220.8
|
220.2
|
216.7
|
0.3
|
1.9
|
|
|
|
Apparel
|
122.1
|
123.5
|
116.7
|
-1.1
|
4.7
|
|
|
|
Transportation
|
210.8
|
208.6
|
200.8
|
1.1
|
5.0
|
|
|
|
Medical Care
|
408.1
|
405.6
|
393.9
|
0.6
|
3.6
|
|
|
|
Recreation (Dec. 1997=100)
|
114.2
|
113.5
|
112.6
|
0.6
|
1.4
|
|
|
|
Education & Communication (Dec. 1997=100)
|
113.1
|
132.7
|
130.7
|
-14.8
|
-13.5
|
|
|
|
Other Goods & Services
|
391.4
|
391.0
|
384.7
|
0.1
|
1.7
|
|
|
|
|
|
|
|
|
|
|
Producer Prices (1982 to 1984 = 100)
|
|
|
|
|
|
|
|
All Commodities
|
200.6
|
200.2
|
192.7
|
0.2
|
4.1
|
|
|
|
|
Wyo. Bldg. Permits (New Privately Owned Housing Units Authorized)
|
|
|
Total Units
|
84
|
64
|
84
|
31.3
|
0.0
|
|
|
|
Valuation
|
$25,620,000
|
$13,596,000
|
$14,646,000
|
88.4
|
74.9
|
|
|
Single Family Homes
|
84
|
57
|
64
|
47.4
|
31.3
|
|
|
|
Valuation
|
$25,620,000
|
$12,996,000
|
$12,940,000
|
97.1
|
98.0
|
|
|
Casper MSA2 Building Permits |
18
|
14
|
9
|
28.6
|
100.0
|
|
|
|
Valuation
|
$4,266,000
|
$2,867,000
|
$1,349,000
|
48.8
|
216.2
|
|
|
Cheyenne MSA Building Permits
|
24
|
12
|
24
|
100.0
|
0.0
|
|
|
|
Valuation
|
$4,514,000
|
$2,275,000
|
$2,938,000
|
98.4
|
53.6
|
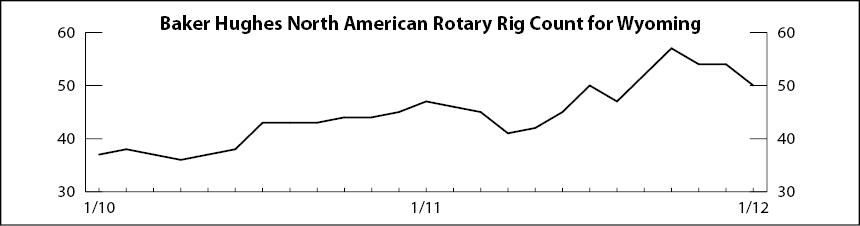
| Baker Hughes North American Rotary Rig Count for Wyoming
|
| |
50
|
54
|
47
|
-7.4
|
6.4
|
|
|
(p) Preliminary. (r) Revised. (b) Benchmarked. |
| 1Local Area Unemployment Statistics Program estimates. |
| 2Metropolitan Statistical Area. |
|
Note: Production worker hours and earnings data have been dropped from the Economic Indicators page because of problems with accuracy due to a small sample size and high item nonresponse. The Bureau of Labor Statistics will continue to publish these data online at http://www.bls.gov/eag/eag.wy.htm |
Last modified
by Phil Ellsworth.
