A Decade Later: Tracking Wyoming's Youth into the Labor Force (Tables and Figures)
See Related Article
Tables 1, 2, 3
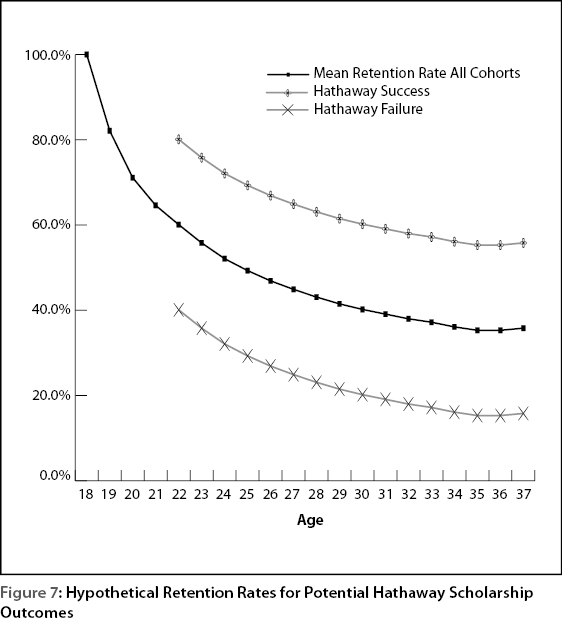
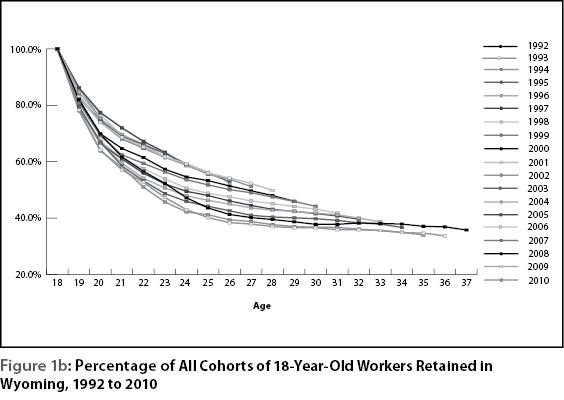
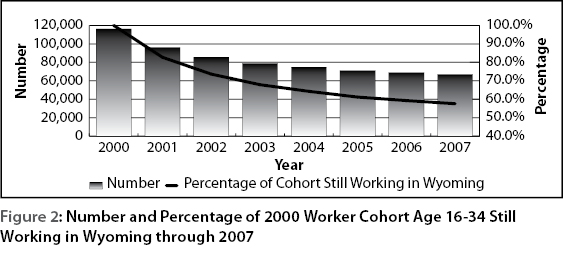
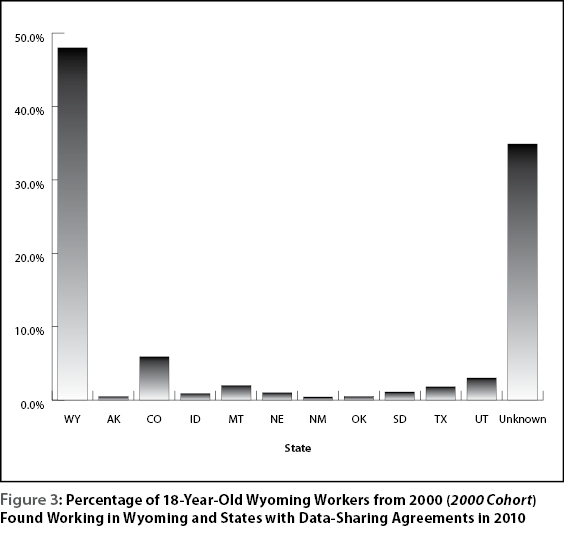
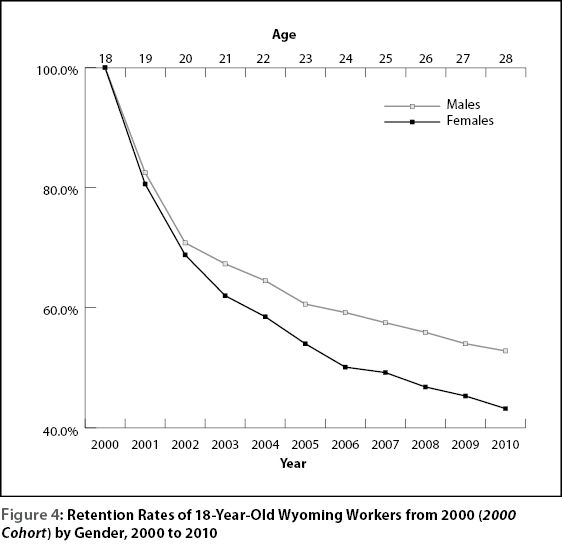
Figures 1a, 1b, 2, 3, 4, 5, 6, 7
| State | 2000 | 2001 | 2002 | 2003 | 2004 | 2005 | 2006 | 2007 | 2008 | 2009 | 2010 | % in 2010 |
|---|---|---|---|---|---|---|---|---|---|---|---|---|
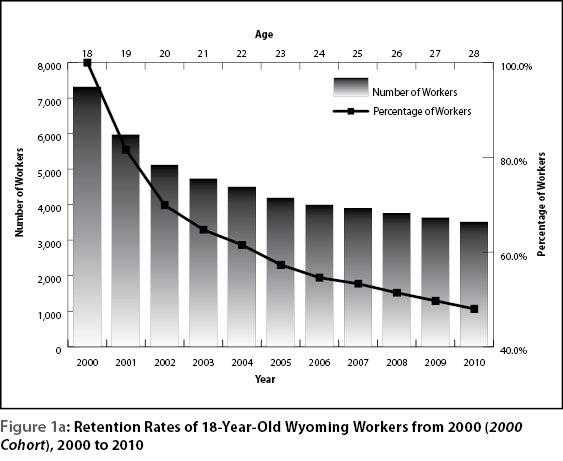
| Wyoming | 7,325 | 5,980 | 5,119 | 4,739 | 4,508 | 4,200 | 4,003 | 3,906 | 3,763 | 3,640 | 3,517 | 48.0% |
| % | 100.0% | 81.6% | 69.9% | 64.7% | 61.5% | 57.3% | 54.6% | 53.3% | 51.4% | 49.7% | 48.0% | |
| Alaska | 12 | 19 | 25 | 34 | 32 | 35 | 28 | 26 | 32 | 36 | 0.5% | |
| Colorado | 170 | 246 | 276 | 329 | 379 | 408 | 423 | 452 | 422 | 435 | 5.9% | |
| Idaho | 29 | 38 | 56 | 71 | 80 | 96 | 86 | 91 | 76 | 65 | 0.9% | |
| Montana | 63 | 118 | 127 | 160 | 175 | 185 | 170 | 162 | 154 | 150 | 2.0% | |
| Nebraska | 27 | 44 | 64 | 68 | 69 | 70 | 61 | 62 | 69 | 70 | 1.0% | |
| New Mexico | 8 | 13 | 17 | 17 | 25 | 26 | 29 | 30 | 26 | 30 | 0.4% | |
| Oklahoma | 11 | 21 | 19 | 0 | 0 | 0 | 21 | 36 | 30 | 35 | 0.5% | |
| South Dakota | 50 | 77 | 107 | 113 | 115 | 94 | 83 | 72 | 81 | 81 | 1.1% | |
| Texas | 50 | 68 | 77 | 92 | 98 | 109 | 113 | 122 | 117 | 129 | 1.8% | |
| Utah | 120 | 165 | 177 | 207 | 224 | 224 | 253 | 252 | 234 | 221 | 3.0% | |
| Subtotal, Data-Sharing States | 540 | 809 | 945 | 1,091 | 1,197 | 1,247 | 1,267 | 1,305 | 1,241 | 1,252 | 17.1% | |
| % | 7.4% | 11.0% | 12.9% | 14.9% | 16.3% | 17.0% | 17.3% | 17.8% | 16.9% | 17.1% | ||
| Subtotal, Unknown | 805 | 1,397 | 1,641 | 1,726 | 1,928 | 2,075 | 2,152 | 2,257 | 2,444 | 2,556 | 34.9% | |
| % | 11.0% | 19.1% | 22.4% | 23.6% | 26.3% | 28.3% | 29.4% | 30.8% | 33.4% | 34.9% | ||
| Total | 7,325 | 7,325 | 7,325 | 7,325 | 7,325 | 7,325 | 7,325 | 7,325 | 7,325 | 7,325 | 7,325 | 100.0% |
| State | 2000 | 2001 | 2002 | 2003 | 2004 | 2005 | 2006 | 2007 | 2008 | 2009 | 2010 | % in 2010 | |
|---|---|---|---|---|---|---|---|---|---|---|---|---|---|
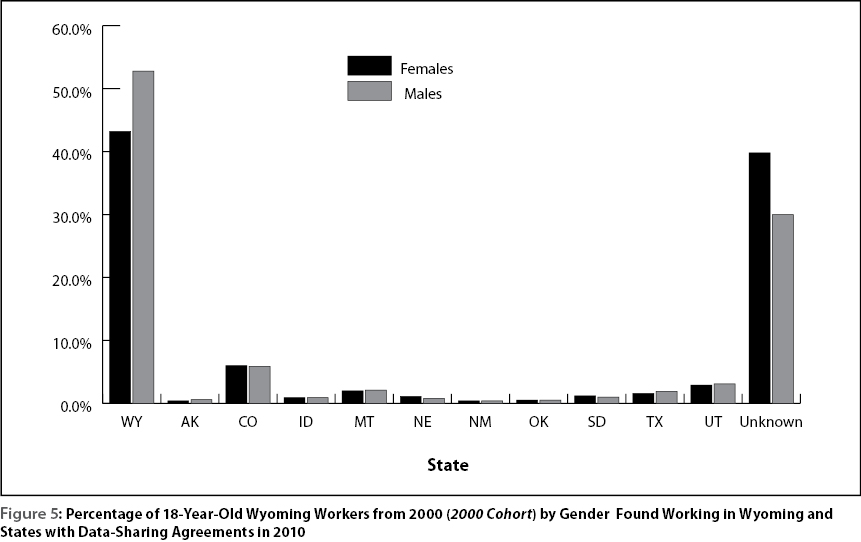
| Females | Wyoming | 3,727 | 3,005 | 2,564 | 2,309 | 2,182 | 2,014 | 1,867 | 1,833 | 1,744 | 1,689 | 1,609 | 43.2% |
| % | 100.0% | 80.6% | 68.8% | 62.0% | 58.5% | 54.0% | 50.1% | 49.2% | 46.8% | 45.3% | 43.2% | ||
| Alaska | 4 | 11 | 14 | 18 | 20 | 21 | 15 | 13 | 13 | 14 | 0.4% | ||
| Colorado | 81 | 118 | 155 | 178 | 204 | 216 | 220 | 235 | 219 | 224 | 6.0% | ||
| Idaho | 19 | 22 | 35 | 39 | 43 | 57 | 44 | 45 | 37 | 34 | 0.9% | ||
| Montana | 34 | 74 | 80 | 95 | 102 | 101 | 96 | 91 | 80 | 75 | 2.0% | ||
| Nebraska | 12 | 26 | 35 | 36 | 39 | 39 | 37 | 39 | 39 | 41 | 1.1% | ||
| New Mexico | 5 | 6 | 10 | 9 | 10 | 15 | 18 | 15 | 12 | 14 | 0.4% | ||
| Oklahoma | 4 | 11 | 12 | 0 | 0 | 0 | 13 | 15 | 15 | 17 | 0.5% | ||
| South Dakota | 32 | 49 | 66 | 66 | 64 | 48 | 49 | 43 | 44 | 46 | 1.2% | ||
| Texas | 25 | 38 | 39 | 49 | 56 | 58 | 58 | 65 | 63 | 60 | 1.6% | ||
| Utah | 73 | 107 | 107 | 110 | 110 | 111 | 119 | 118 | 111 | 109 | 2.9% | ||
|
Subtotal, Data-Sharing States |
289 | 462 | 553 | 600 | 648 | 666 | 669 | 679 | 633 | 634 | 17.0% | ||
| % | 7.8% | 12.4% | 14.8% | 16.1% | 17.4% | 17.9% | 18.0% | 18.2% | 17.0% | 17.0% | |||
| Subtotal, Unknown | 433 | 701 | 865 | 945 | 1,065 | 1,194 | 1,225 | 1,304 | 1,405 | 1,484 | 39.8% | ||
| % | 11.6% | 18.8% | 23.2% | 25.4% | 28.6% | 32.0% | 32.9% | 35.0% | 37.7% | 39.8% | |||
| Total, All Females | 3,727 | 3,727 | 3,727 | 3,727 | 3,727 | 3,727 | 3,727 | 3,727 | 3,727 | 3,727 | 3,727 | 100.0% | |
| Males | Wyoming | 3,570 | 2,947 | 2,528 | 2,404 | 2,302 | 2,162 | 2,113 | 2,051 | 1,996 | 1,929 | 1,885 | 52.8% |
| % | 100.0% | 82.5% | 70.8% | 67.3% | 64.5% | 60.6% | 59.2% | 57.5% | 55.9% | 54.0% | 52.8% | ||
| Alaska | 8 | 8 | 11 | 16 | 12 | 14 | 13 | 13 | 18 | 21 | 0.6% | ||
| Colorado | 89 | 128 | 121 | 151 | 175 | 192 | 202 | 216 | 201 | 209 | 5.9% | ||
| Idaho | 10 | 16 | 21 | 32 | 37 | 39 | 40 | 44 | 39 | 31 | 0.9% | ||
| Montana | 29 | 44 | 47 | 64 | 73 | 84 | 74 | 71 | 74 | 75 | 2.1% | ||
| Nebraska | 15 | 18 | 29 | 31 | 29 | 30 | 24 | 23 | 30 | 29 | 0.8% | ||
| New Mexico | 3 | 7 | 7 | 8 | 15 | 11 | 11 | 15 | 14 | 16 | 0.4% | ||
| Oklahoma | 7 | 10 | 7 | 0 | 0 | 0 | 8 | 21 | 15 | 18 | 0.5% | ||
| South Dakota | 18 | 28 | 41 | 47 | 51 | 46 | 34 | 29 | 37 | 35 | 1.0% | ||
| Texas | 25 | 30 | 38 | 43 | 42 | 51 | 55 | 57 | 54 | 69 | 1.9% | ||
| Utah | 47 | 58 | 70 | 97 | 114 | 113 | 134 | 134 | 123 | 112 | 3.1% | ||
|
Subtotal, Data-Sharing States |
251 | 347 | 392 | 489 | 548 | 580 | 595 | 623 | 605 | 615 | |||
| % | 7.0% | 9.7% | 11.0% | 13.7% | 15.4% | 16.2% | 16.7% | 17.5% | 16.9% | 17.2% | |||
| Subtotal, Unknown | 372 | 695 | 774 | 779 | 860 | 877 | 924 | 951 | 1,036 | 1,070 | 30.0% | ||
| % | 10.4% | 19.5% | 21.7% | 21.8% | 24.1% | 24.6% | 25.9% | 26.6% | 29.0% | 30.0% | |||
| Total, All Males | 3,570 | 3,570 | 3,570 | 3,570 | 3,570 | 3,570 | 3,570 | 3,570 | 3,570 | 3,570 | 3,570 | 100.0% | |
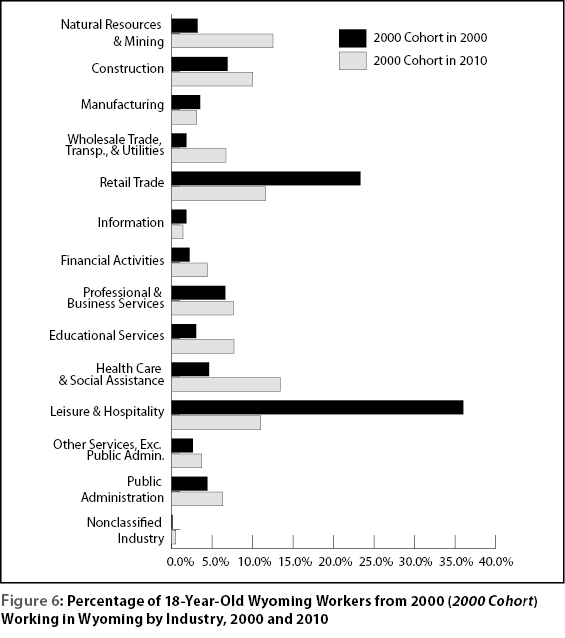
| 2000 | 2010 | |||
|---|---|---|---|---|
| Industry | n | Column % | n | Column % |
| Natural Resources & Mining | 237 | 3.2% | 440 | 12.5% |
| Construction | 502 | 6.9% | 352 | 10.0% |
| Manufacturing | 254 | 3.5% | 110 | 3.1% |
| Wholesale Trade, Transportation, & Utilities | 135 | 1.8% | 237 | 6.7% |
| Retail Trade | 1,707 | 23.3% | 409 | 11.6% |
| Information | 133 | 1.8% | 50 | 1.4% |
| Financial Activities | 159 | 2.2% | 153 | 4.4% |
| Professional & Business Services | 483 | 6.6% | 269 | 7.6% |
| Educational Services | 220 | 3.0% | 270 | 7.7% |
| Health Care & Social Assistance | 338 | 4.6% | 471 | 13.4% |
| Leisure & Hospitality | 2,635 | 36.0% | 387 | 11.0% |
| Other Services, Except Public Administration | 192 | 2.6% | 129 | 3.7% |
| Public Administration | 324 | 4.4% | 221 | 6.3% |
| Nonclassified Industry | 6 | 0.1% | 19 | 0.5% |
| Total, All Industries | 7,325 | 100.0% | 3,517 | 100.0% |