Economic Indicators
The consumer price index rose 1.5% from December 2012 to December 2013.
| Dec | Nov | Dec | Percent Change | ||||
|---|---|---|---|---|---|---|---|
| 2013 (p) | 2013 (r) | 2012 (b) | Month | Year | |||
| Wyoming Total Nonfarm Employment | 290,000 | 290,300 | 286,400 | -0.1 | 1.3 | ||
| Wyoming State Government | 15,800 | 16,000 | 16,100 | -1.3 | -1.9 | ||
| Laramie County Nonfarm Employment | 46,000 | 46,400 | 45,700 | -0.9 | 0.7 | ||
| Natrona County Nonfarm Employment | 41,600 | 41,800 | 41,500 | -0.5 | 0.2 | ||
| Selected U.S. Employment Data | |||||||
| U.S. Multiple Jobholders | 6,934,000 | 6,973,000 | 7,081,000 | -0.6 | -2.1 | ||
| As a percent of all workers | 4.8% | 4.8% | 4.9% | N/A | N/A | ||
| U.S. Discouraged Workers | 917,000 | 762,000 | 1,068,000 | 20.3 | -14.1 | ||
| U.S. Part Time for Economic Reasons | 7,990,000 | 7,563,000 | 8,166,000 | 5.6 | -2.2 | ||
| Wyoming Unemployment Insurance | |||||||
| Weeks Compensated | 22,922 | 16,125 | 22,643 | 42.2 | 1.2 | ||
| Benefits Paid | $7,944,003 | $5,466,340 | $7,630,442 | 45.3 | 4.1 | ||
| Average Weekly Benefit Payment | $346.57 | $339.00 | $336.99 | 2.2 | 2.8 | ||
| State Insured Covered Jobs1 | 268,564 | 268,388 | 267,946 | 0.1 | 0.2 | ||
| Insured Unemployment Rate | 2.6% | 2.2% | 3.1% | N/A | N/A | ||
| Consumer Price Index (U) for All U.S. Urban Consumers | |||||||
| (1982 to 1984 = 100) | |||||||
| All Items | 233.0 | 233.1 | 229.6 | 0.0 | 1.5 | ||
| Food & Beverages | 237.8 | 237.6 | 235.2 | 0.1 | 1.1 | ||
| Housing | 228.9 | 228.4 | 224.0 | 0.2 | 2.2 | ||
| Apparel | 126.5 | 129.4 | 125.7 | -2.3 | 0.6 | ||
| Transportation | 212.9 | 212.8 | 211.9 | 0.0 | 0.5 | ||
| Medical Care | 427.1 | 427.7 | 418.7 | -0.2 | 2.0 | ||
| Recreation (Dec. 1997=100) | 114.9 | 115.3 | 114.4 | -0.4 | 0.4 | ||
| Education & Communication (Dec. 1997=100) | 136.9 | 136.8 | 134.7 | 0.0 | 1.6 | ||
| Other Goods & Services | 404.1 | 403.0 | 396.8 | 0.3 | 1.8 | ||
| Producer Prices (1982 to 1984 = 100) | |||||||
| All Commodities | 201.8 | 201.0 | 201.5 | 0.4 | 0.1 | ||
| Wyo. Bldg. Permits (New Privately Owned Housing Units Authorized) | |||||||
| Total Units | 92 | 144 | 168 | -36.1 | -45.2 | ||
| Valuation | $24,867,000 | $28,888,000 | $19,890,000 | -13.9 | 25.0 | ||
| Single Family Homes | 87 | 107 | 62 | -18.7 | 40.3 | ||
| Valuation | $24,439,000 | $26,360,000 | $13,103,000 | -7.3 | 86.5 | ||
| Casper MSA2 Building Permits | 7 | 53 | 43 | -86.8 | -83.7 | ||
| Valuation | $1,698,000 | $7,084,000 | $5,518,000 | -76.0 | -69.2 | ||
| Cheyenne MSA Building Permits | 40 | 37 | 20 | 8.1 | 100.0 | ||
| Valuation | $7,081,000 | $5,451,000 | $3,641,000 | 29.9 | 94.5 | ||
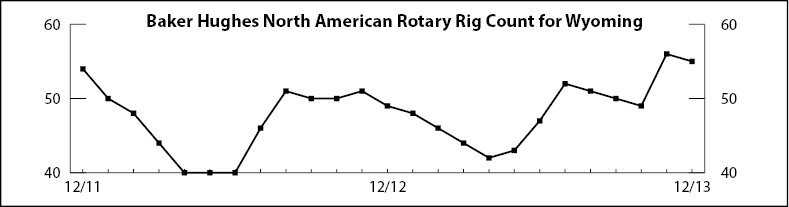
| Baker Hughes North American Rotary Rig Count for Wyoming | 55 | 56 | 49 | -1.8 | 12.2 | ||
|
|||||||
| (p) Preliminary. (r) Revised. (b) Benchmarked. | |||||||
| 1Local Area Unemployment Statistics Program estimates. | |||||||
| 2Metropolitan Statistical Area. | |||||||
| Note: Production worker hours and earnings data have been dropped from the Economic Indicators page because of problems with accuracy due to a small sample size and high item nonresponse. The Bureau of Labor Statistics will continue to publish these data online at http://www.bls.gov/eag/eag.wy.htm. | |||||||