BLS Offers Redesigned Site on Employment, Wages
The U.S. Bureau of Labor Statistics (BLS) has redesigned its Occupational Employment Statistics (OES) website, providing users with customizable charts, tables, and maps for almost 800 occupations, 400 industries, and 500 areas, including state, metropolitan, and non-metropolitan areas.
Updated OES Data
Available March 29
The May 2012 Occupational Employment Statistics (OES) data are scheduled to be released on March 29, and will use the full 2010 Standard Occupational Classification (SOC) System, plus one OES occupation: 25-3098, substitute teachers. It will also use the 2012 NAICS industry classification system.
For more information about the 2010 SOC visit the SOC website at http://www.bls.gov/SOC/. For information about how the 2010 SOC occupations compared to the occupational structure used in OES in 2010 and 2011, please see the FAQ page.
For more information about the 2012 NAICS, please click here.
The OES website can be found at http://www.bls.gov/oes/home.htm. The data, tables, charts, and maps can be found by clicking the "OES Data button."
Area profiles are available for the national, state, and metropolitan and nonmetropolitan area levels. The Table shows a sample of a state profile for Wyoming, listing the top 10 occupations with the highest employment. This type of table can also be created for the Casper and Cheyenne metropolitan statistical areas (MSA) and Wyoming's northeast, northwest, southeast, and southwest regions.
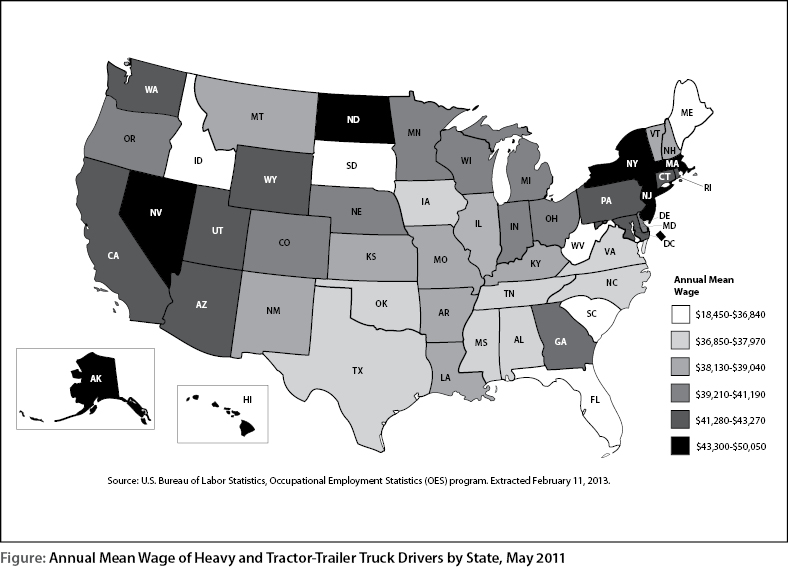
Several map and chart tools can be used to compare Wyoming employment and wages to other states and the U.S. as a whole. The Figure shows the annual mean wage for heavy & tractor-trailer truck drivers for all 50 states and the District of Columbia. This map illustrates that the annual mean wage for truck drivers in Wyoming is on the higher end of the spectrum. By comparison, truck drivers in Idaho and South Dakota have two of the lowest annual mean wages in the country.
Similar maps and graphics can be created to compare employment, wages, and location quotients.
| SOC1 Code | Occupation | Employment | Employment RSE2 | Employment per 1,000 Jobs | Location Quotient3 | Mean Hourly Wage ($) | Median Hourly Wage ($) | Annual Mean Wage ($) | Mean Wage RSE2 |
|---|---|---|---|---|---|---|---|---|---|
| 41-2031 | Retail Salespersons | 7,900 | 3.3 | 29.0 | 0.87 | 12.09 | 10.49 | 25,140 | 1.8 |
| 53-3032 | Heavy & Tractor-Trailer Truck Drivers | 6,150 | 4.8 | 22.6 | 1.92 | 20.80 | 20.08 | 43,270 | 1.9 |
| 41-2011 | Cashiers | 5,810 | 4.4 | 21.3 | 0.82 | 9.72 | 9.32 | 20,210 | 1.2 |
| 43-6014 | Secretaries & Administrative Assistants, Except Legal, Medical, & Executive | 5,760 | 3.0 | 21.1 | 1.39 | 14.64 | 14.44 | 30,460 | 1.0 |
| 47-2073 | Operating Engineers & Other Construction Equipment Operators | 5,600 | 18.9 | 20.5 | 7.86 | 23.04 | 22.56 | 47,930 | 2.6 |
| 11-1021 | General & Operations Managers | 5,190 | 2.4 | 19.0 | 1.35 | 41.96 | 36.90 | 87,270 | 1.4 |
| 29-1111 | Registered Nurses | 4,800 | 4.2 | 17.6 | 0.83 | 29.29 | 28.50 | 60,930 | 1.3 |
| 43-3031 | Bookkeeping, Accounting, & Auditing Clerks | 4,700 | 3.4 | 17.3 | 1.35 | 16.79 | 16.16 | 34,920 | 1.0 |
| 35-3031 | Waiters & Waitresses | 4,690 | 6.5 | 17.2 | 0.96 | 8.94 | 8.58 | 18,600 | 2.3 |
| 37-2011 | Janitors & Cleaners, Except Maids & Housekeeping Cleaners | 4,550 | 3.0 | 16.7 | 1.04 | 12.53 | 12.00 | 26,060 | 1.2 |
| Total, All Occupations | 272,570 | 1.1 | 1,000.0 | 1.00 | 20.44 | 17.37 | 42,510 | 0.8 | |
| 1Standard Occupational Classification System. | |||||||||
| 2Relative Standard Error. | |||||||||
| 3A location quotient is a measure of the concentration of the occupation in the area relative to the national average. More information can be found at http://www.bls.gov/cew/cewlq.htm. | |||||||||
| Source: U.S. Bureau of Labor Statistics, Occupational Employment Statistics (http://www.bls.gov/oes/home.htm). | |||||||||