Appendix
Employer Benefits Survey Methodology
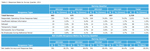 |
In 2011, benefits survey questionnaires were mailed to 2,729 randomly selected Wyoming employers (see Table 2). The data collected in the 2011 survey were from a stratified random sample based on employer industry, size, and region. The questionnaires went to employers in the private sector as well as state and local government. Estimates were not stratified by region. Each quarter a select number of these employers were sent a survey, ranging from 675 employers in second and third quarters 2011 to 697 in fourth quarter 2011. Approximately 2.5% of available employment from the QCEW was sampled each quarter1. In total, these employers covered one-tenth of total Wyoming employment. Compilation of data and estimation were completed following the end of the calendar year.
The questionnaire asked employers to report information for the 12th day of the month of the second month of the quarter in which they were sent a survey. For example, respondents surveyed in the second quarter (April, May, June) were asked to report values as of May 12. Thus the results in this publication are point-in-time estimates. Because the labor market is changing, the true value at a given time may differ somewhat from published estimates. For example, if a large manufacturing firm opens in mid-July and provides the benefits typical of manufacturing firms and is not included in the benefits survey sample, the published estimates will not capture that change.
To reduce sample fatigue (e.g., mailing employers multiple surveys during a short period), employers who received a benefits survey in either of the two quarters prior to the reference quarter were eliminated. Employers who were out of business, refused to respond, or could not be located during the prior eight quarters also were eliminated. Once an employer responded to the survey, that employer was not eligible to be included in the sample for at least eight quarters.
Employers were classified into industries by subsector using the first two digits of each firm’s North American Industry Classification System (NAICS) code. In Wyoming, public schools, colleges, and hospitals are normally tabulated with state and local government. However, in order to show how benefits are distributed to these workers, public schools, colleges, and hospitals are coded in this publication as educational & health services instead.
The sample for each quarter was drawn using the quarter one year prior to the reference quarter. For example, the sample for first quarter 2011 was drawn using the first quarter 2010 QCEW file. Address correction was performed in two steps. The first step involved applying addresses from the most recent quarter of QCEW data to the employers in the source file. In this case, addresses from second quarter 2010 were used to correct the first quarter 2010 file. In the second step, a letter was sent to employers to notify them the survey would soon arrive. Addresses were refined if notification letters were returned by the postal service. Other address refinement methods included researching employers who use payroll providers to find their mailing addresses, as payroll providers generally will not complete surveys on behalf of their clients.
Analysis Procedures
For this survey, the universe refers to all employers in Wyoming covered by state Unemployment Insurance. A representative sample was drawn from the universe. Ideally, the distribution of employers’ responses would correspond to the distribution of employers in the universe, but this frequently does not happen. In order to correct for differences, weights were applied to survey responses. Depending upon the level of analysis, data were weighted according to firms’ total employment or the number of firms located in each sample stratum cell. Strata refer to two or more subgroups in which the total universe of employers is divided into non-overlapping subgroups. A stratum cell refers to a single subpopulation of strata. For example, if employers in a certain industry and of a certain size report a total of 200 workers during the survey reference period, and the 2010 QCEW data showed there were 1,200 workers in that industry in the state, each firm would receive an employment weight of 1,200/200, or 6.0. Likewise, if the number of responding firms was 6 and the total number in a stratum cell was 20, the weight applied when analyzing data by the number of firms would be 20/6, or 3.333.
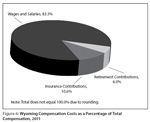 |
In addition to weighting procedures, some data required adjustment if responses did not match the information employers reported in the QCEW file. If the ratio of employment reported on the survey to the last reported QCEW value was greater than 1.5 or less than 0.666, responses were adjusted accordingly. For example, if an employer reported 200 employees on the survey form, but reported 100 employees to QCEW, all of that survey’s numeric responses (excluding benefit expenditures) were adjusted by a factor of 0.5. If the employer reported wages on the survey, this value was also checked against the QCEW file. If the ratio was outside the range, the wage, retirement, and insurance expenditure figures were adjusted proportionately. Using these data adjustments, the proportions of compensation were estimated as shown in Figure 6. This figure shows 83.3% of total compensation in 2011 was composed of wages and salaries followed by insurance contributions (10.6%) and retirement contributions (6.0%).
Of the 2,729 employers who received a questionnaire, 2,031 (74.4%) completed and returned them. There were 86 employers (3.2%) who refused to participate, 48 (1.8%) who were temporarily closed, 74 (2.7%) who were permanently out of business, 41 (1.5%) with insufficient address information, and 115 (4.2%) who reported zero employees during the survey reference period. Refusals, employers who were out of business, had no employees, or could not be contacted were removed from the initial number of questionnaires sent out because no valid data could be obtained. This left a net total of 2,365 useable questionnaires and an overall net useable response rate of 85.9% (completed questionnaires/net useable questionnaires). During the four quarters of 2011, the net useable response rate ranged from a low of 84.4% in the fourth quarter to a high of 88.6% in the second quarter.
References
U.S. Department of Labor, Bureau of Labor Statistics. (n.d.). Quarterly Census of Employment and Wages. Accessed November 20, 2012, from http://www.bls.gov/cew/
1Data for QCEW come from UI-covered employment records. Approximately 98% of employment is covered by Unemployment Insurance in the U.S., making it a near-census of employment in the states (U.S. Department of Labor, Bureau of Labor Statistics, n.d.). Among the types of firms excluded are railroads and some agricultural operations. For a complete list of businesses excluded from coverage, go to the Technical Appendix of “Wyoming 2000 Annual Covered Employment and Wages” at http://doe.state.wy.us/LMI/00202pub/tech_app.htm.