Tables and Figures
Tables: 1a, 1b, 1c, 2, 3, 4, 5, 6a, 6b, 7, 8, 9, 10, 11, 12, 13, 14, 15, 16, 17
Figures: 1, 2, 3, 4, 5, 6, 7, 8, 9, 10, 11, 12, 13, 14
| Benefit Type | Number of Employees Per Firm | |||||||||||||||||
|---|---|---|---|---|---|---|---|---|---|---|---|---|---|---|---|---|---|---|
| 2008 | 2011 | Difference, 2008-2011a | ||||||||||||||||
| 1-4 | 5-9 | 10-19 | 20-49 | 50+ | Total | 1-4 | 5-9 | 10-19 | 20-49 | 50+ | Total | 1-4 | 5-9 | 10-19 | 20-49 | 50+ | Total | |
| Child Care | 1.7% | 3.5% | 3.8% | 5.1% | 21.1% | 14.0% | 1.2% | 3.1% | 2.0% | 3.6% | 13.4% | 9.1% | -0.5% | -0.4% | -1.7% | -1.6% | -7.7% | -4.9% |
| Dental Plan | 22.3% | 29.0% | 43.3% | 64.1% | 85.1% | 68.4% | 23.6% | 35.2% | 44.1% | 60.6% | 87.6% | 70.5% | 1.3% | 6.2% | 0.8% | -3.5% | 2.5% | 2.0% |
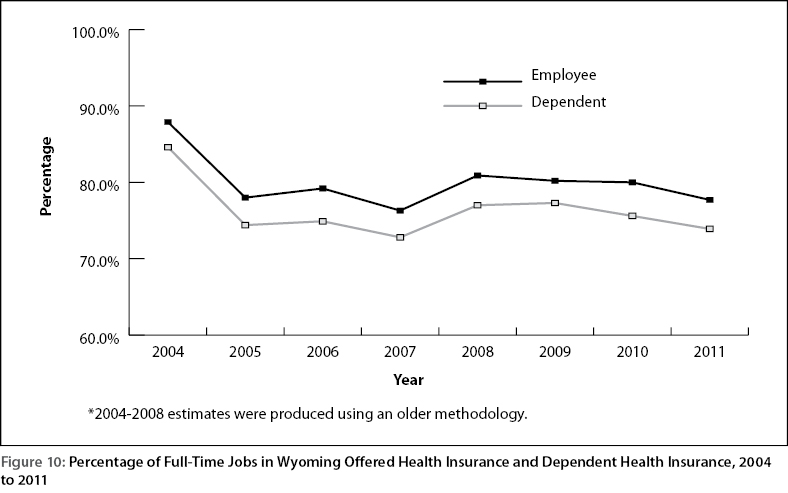
| Dependent Health Ins. | 29.3% | 34.2% | 57.3% | 72.7% | 93.2% | 76.9% | 26.0% | 40.5% | 49.6% | 63.4% | 90.6% | 73.9% | -3.3% | 6.3% | -7.7% | -9.3% | -2.5% | -3.0% |
| Educational/Tuition Assist. | 22.4% | 26.0% | 26.5% | 32.9% | 63.8% | 49.0% | 21.1% | 21.8% | 27.6% | 36.7% | 67.3% | 51.8% | -1.3% | -4.2% | 1.1% | 3.8% | 3.5% | 2.7% |
| Flex. Spending Account | 8.8% | 11.9% | 20.0% | 31.7% | 70.8% | 50.2% | 12.6% | 13.2% | 18.8% | 31.5% | 72.4% | 51.9% | 3.9% | 1.3% | -1.2% | -0.1% | 1.6% | 1.7% |
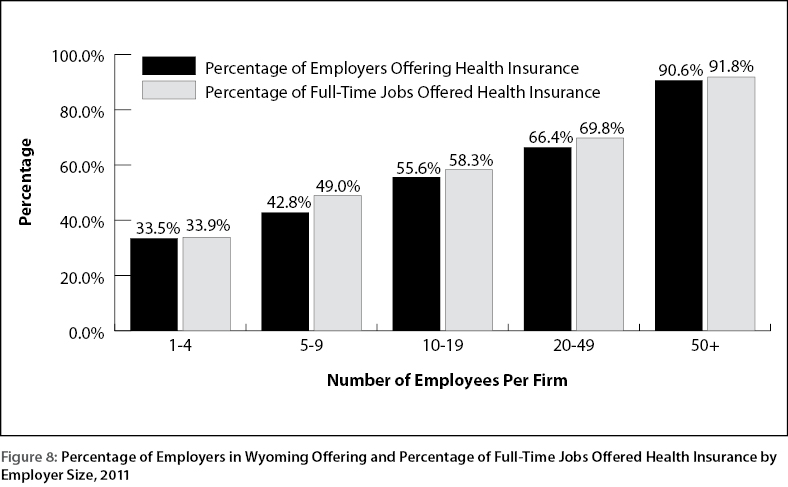
| Health Insurance | 36.2% | 45.0% | 65.6% | 78.4% | 94.1% | 80.6% | 33.9% | 49.0% | 58.3% | 69.8% | 91.8% | 77.7% | -2.3% | 3.9% | -7.3% | -8.6% | -2.3% | -2.9% |
| Life Insurance | 21.5% | 28.7% | 40.5% | 66.5% | 91.2% | 72.0% | 20.8% | 29.3% | 41.4% | 58.8% | 86.9% | 68.8% | -0.7% | 0.6% | 0.9% | -7.7% | -4.3% | -3.2% |
| Long-Term Disability | 10.1% | 10.3% | 16.2% | 27.7% | 59.4% | 42.4% | 11.8% | 8.0% | 14.7% | 24.5% | 67.3% | 46.9% | 1.7% | -2.4% | -1.6% | -3.2% | 7.9% | 4.5% |
| Paid Holidays | 54.6% | 63.2% | 65.1% | 70.7% | 82.7% | 75.4% | 54.8% | 62.0% | 62.2% | 72.1% | 88.5% | 78.9% | 0.2% | -1.1% | -2.9% | 1.4% | 5.9% | 3.5% |
| Paid Personal Leave | 24.2% | 25.7% | 28.5% | 33.4% | 48.7% | 40.6% | 18.6% | 23.2% | 26.9% | 28.0% | 41.9% | 35.2% | -5.6% | -2.6% | -1.6% | -5.4% | -6.8% | -5.4% |
| Paid Sick Leave | 27.6% | 23.5% | 28.9% | 35.8% | 52.5% | 43.3% | 24.7% | 31.2% | 32.5% | 36.2% | 63.4% | 50.9% | -2.9% | 7.7% | 3.5% | 0.4% | 10.9% | 7.7% |
| Paid Vacation | 53.1% | 57.3% | 67.7% | 74.2% | 77.4% | 72.5% | 45.2% | 59.5% | 63.5% | 76.1% | 78.9% | 73.0% | -7.9% | 2.1% | -4.1% | 1.9% | 1.6% | 0.5% |
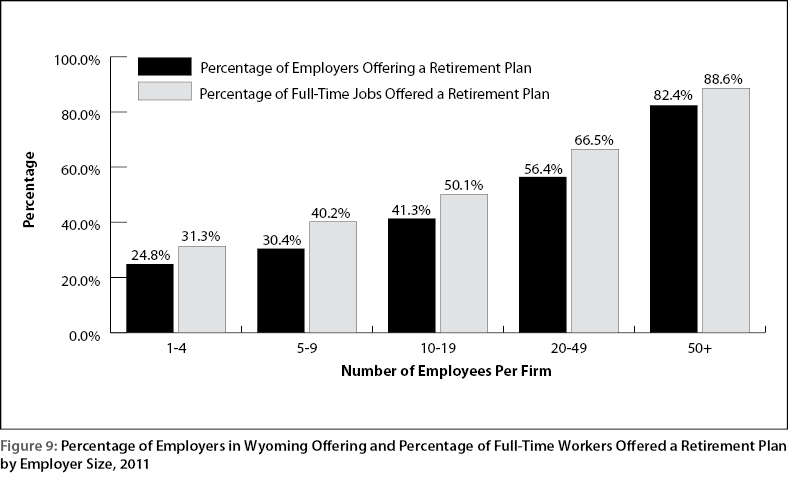
| Retirement Plan | 32.5% | 43.8% | 58.6% | 73.8% | 94.4% | 79.0% | 31.3% | 40.2% | 50.1% | 66.5% | 88.6% | 73.5% | -1.2% | -3.6% | -8.5% | -7.3% | -5.8% | -5.5% |
| Short-Term Disability | 11.9% | 11.5% | 18.4% | 28.1% | 46.9% | 35.6% | 11.5% | 10.4% | 18.5% | 23.8% | 54.7% | 39.9% | -0.4% | -1.1% | 0.1% | -4.3% | 7.8% | 4.3% |
| Vision Plan | 11.4% | 15.4% | 24.6% | 41.7% | 69.3% | 51.8% | 10.7% | 18.6% | 27.8% | 48.7% | 73.4% | 56.3% | -0.8% | 3.2% | 3.3% | 6.9% | 4.2% | 4.5% |
| aThe difference is calculated as the simple difference between the 2008 and 2011 percentages. | ||||||||||||||||||
| Benefit Type | Number of Employees Per Firm | |||||||||||||||||
|---|---|---|---|---|---|---|---|---|---|---|---|---|---|---|---|---|---|---|
| 2008 | 2011 | Difference, 2008-2011a | ||||||||||||||||
| 1-4 | 5-9 | 10-19 | 20-49 | 50+ | Total | 1-4 | 5-9 | 10-19 | 20-49 | 50+ | Total | 1-4 | 5-9 | 10-19 | 20-49 | 50+ | Total | |
| Child Care | 1.2% | 0.3% | 1.7% | 2.8% | 7.2% | 7.2% | 0.6% | 0.9% | 2.3% | 1.3% | 12.4% | 6.6% | -0.6% | 0.6% | 0.6% | -1.5% | 5.2% | -0.6% |
| Dental Plan | 1.0% | 1.2% | 2.8% | 8.2% | 16.1% | 16.1% | 1.5% | 2.2% | 3.3% | 4.4% | 17.5% | 9.9% | 0.5% | 1.0% | 0.5% | -3.9% | 1.4% | -6.2% |
| Dependent Health Ins. | 0.5% | 0.6% | 1.4% | 3.7% | 15.8% | 15.8% | 1.6% | 1.1% | 3.3% | 2.4% | 14.6% | 8.1% | 1.1% | 0.5% | 1.9% | -1.2% | -1.2% | -7.7% |
| Educational/Tuition Assist. | 10.2% | 8.8% | 8.8% | 8.1% | 31.8% | 31.8% | 6.6% | 7.5% | 11.0% | 7.9% | 17.7% | 12.8% | -3.6% | -1.3% | 2.2% | -0.2% | -14.1% | -19.0% |
| Flexible Spending Account | 1.2% | 1.3% | 0.8% | 6.7% | 24.6% | 24.6% | 0.8% | 0.6% | 2.5% | 1.6% | 22.4% | 11.4% | -0.4% | -0.7% | 1.7% | -5.1% | -2.1% | -13.2% |
| Health Insurance | 3.0% | 3.8% | 3.4% | 5.8% | 17.2% | 17.2% | 2.1% | 1.7% | 3.8% | 2.2% | 17.9% | 9.7% | -0.8% | -2.2% | 0.4% | -3.6% | 0.7% | -7.4% |
| Life Insurance | 1.9% | 1.0% | 2.8% | 8.3% | 15.2% | 15.2% | 1.2% | 0.6% | 0.9% | 7.8% | 16.1% | 9.3% | -0.7% | -0.3% | -1.9% | -0.5% | 0.9% | -6.0% |
| Long-Term Disability | 0.4% | 0.4% | 0.8% | 1.2% | 11.5% | 11.5% | 0.4% | 0.4% | 0.3% | 1.8% | 9.5% | 4.9% | 0.0% | 0.0% | -0.5% | 0.6% | -2.1% | -6.6% |
| Paid Holidays | 13.4% | 17.6% | 15.2% | 11.2% | 24.1% | 24.1% | 15.2% | 10.8% | 14.8% | 19.1% | 24.5% | 19.7% | 1.8% | -6.7% | -0.5% | 8.0% | 0.4% | -4.4% |
| Paid Personal Leave | 6.0% | 5.2% | 5.4% | 9.0% | 28.4% | 28.4% | 6.2% | 3.2% | 7.7% | 4.2% | 21.7% | 13.0% | 0.2% | -2.0% | 2.3% | -4.8% | -6.7% | -15.4% |
| Paid Sick Leave | 5.6% | 4.7% | 3.3% | 5.6% | 17.8% | 17.8% | 4.2% | 4.6% | 4.9% | 4.4% | 26.0% | 14.7% | -1.4% | -0.1% | 1.6% | -1.3% | 8.2% | -3.2% |
| Paid Vacation | 12.1% | 14.2% | 14.9% | 13.6% | 21.3% | 21.3% | 8.6% | 7.6% | 13.2% | 19.8% | 16.1% | 14.6% | -3.4% | -6.6% | -1.7% | 6.2% | -5.3% | -6.7% |
| Retirement Plan | 9.5% | 9.5% | 15.1% | 22.8% | 52.0% | 52.0% | 6.3% | 8.2% | 8.6% | 9.6% | 43.4% | 25.0% | -3.2% | -1.3% | -6.5% | -13.2% | -8.6% | -27.1% |
| Short-Term Disability | 0.2% | 1.3% | 1.2% | 1.7% | 4.9% | 4.9% | 0.4% | 1.1% | 0.5% | 2.6% | 8.2% | 4.6% | 0.2% | -0.1% | -0.8% | 1.0% | 3.4% | -0.3% |
| Vision Plan | 0.1% | 1.1% | 0.6% | 3.7% | 14.2% | 14.2% | 0.4% | 0.4% | 1.2% | 2.6% | 15.3% | 7.9% | 0.3% | -0.7% | 0.5% | -1.1% | 1.1% | -6.3% |
| aThe difference is calculated as the simple difference between the 2008 and 2011 percentages. | ||||||||||||||||||
| Benefit Type | Number of Employees Per Firm | |||||||||||||||||
|---|---|---|---|---|---|---|---|---|---|---|---|---|---|---|---|---|---|---|
| 2008 | 2011 | Difference, 2008-2011a | ||||||||||||||||
| 1-4 | 5-9 | 10-19 | 20-49 | 50+ | Total | 1-4 | 5-9 | 10-19 | 20-49 | 50+ | Total | 1-4 | 5-9 | 10-19 | 20-49 | 50+ | Total | |
| Child Care | 1.5% | 2.5% | 3.1% | 4.5% | 18.2% | 11.7% | 1.0% | 2.4% | 2.1% | 2.9% | 13.2% | 8.5% | -0.6% | -0.2% | -1.0% | -1.6% | -5.0% | -3.2% |
| Dental Plan | 16.2% | 20.6% | 30.7% | 50.0% | 70.8% | 54.3% | 16.5% | 24.3% | 32.1% | 44.4% | 73.1% | 55.4% | 0.4% | 3.6% | 1.5% | -5.7% | 2.3% | 1.1% |
| Dependent Health Ins. | 21.0% | 24.1% | 39.9% | 55.3% | 77.2% | 60.5% | 18.2% | 27.4% | 36.0% | 45.8% | 74.9% | 57.5% | -2.8% | 3.4% | -3.9% | -9.5% | -2.2% | -2.9% |
| Educational/Tuition Assist. | 18.9% | 20.8% | 21.0% | 26.6% | 57.2% | 42.0% | 16.5% | 17.1% | 22.7% | 28.4% | 57.0% | 42.1% | -2.4% | -3.8% | 1.7% | 1.7% | -0.2% | 0.1% |
| Flex. Spending Account | 6.6% | 8.7% | 14.0% | 25.4% | 61.2% | 41.3% | 8.8% | 9.0% | 14.0% | 22.9% | 62.1% | 41.8% | 2.2% | 0.3% | 0.0% | -2.5% | 0.8% | 0.5% |
| Health Insurance | 26.7% | 32.7% | 46.2% | 60.1% | 78.2% | 63.8% | 23.7% | 33.3% | 42.4% | 50.3% | 76.5% | 60.8% | -2.9% | 0.6% | -3.9% | -9.8% | -1.7% | -3.0% |
| Life Insurance | 15.8% | 20.3% | 28.7% | 51.8% | 75.5% | 57.0% | 14.5% | 19.8% | 29.5% | 44.1% | 72.3% | 54.0% | -1.3% | -0.5% | 0.7% | -7.7% | -3.2% | -3.0% |
| Long-Term Disability | 7.3% | 7.4% | 11.4% | 21.0% | 49.5% | 33.7% | 8.2% | 5.5% | 10.5% | 18.0% | 55.3% | 36.5% | 0.8% | -1.9% | -1.0% | -3.1% | 5.8% | 2.8% |
| Paid Holidays | 42.8% | 49.5% | 49.5% | 55.7% | 70.5% | 61.8% | 42.1% | 45.1% | 48.3% | 56.8% | 75.3% | 64.2% | -0.6% | -4.4% | -1.3% | 1.1% | 4.7% | 2.3% |
| Paid Personal Leave | 19.0% | 19.5% | 21.3% | 27.2% | 44.5% | 35.0% | 14.6% | 16.5% | 21.3% | 21.2% | 37.7% | 29.7% | -4.3% | -3.0% | -0.1% | -6.1% | -6.8% | -5.3% |
| Paid Sick Leave | 21.3% | 17.8% | 20.9% | 28.2% | 45.3% | 35.5% | 18.1% | 22.4% | 24.4% | 27.0% | 55.7% | 41.9% | -3.2% | 4.5% | 3.4% | -1.2% | 10.3% | 6.4% |
| Paid Vacation | 41.3% | 44.4% | 51.2% | 59.0% | 65.8% | 59.3% | 33.5% | 42.3% | 48.8% | 59.9% | 66.0% | 58.5% | -7.8% | -2.1% | -2.4% | 0.9% | 0.2% | -0.8% |
| Retirement Plan | 25.9% | 33.5% | 45.0% | 61.0% | 85.7% | 68.0% | 23.3% | 29.6% | 37.9% | 50.1% | 79.3% | 61.4% | -2.6% | -3.9% | -7.1% | -10.9% | -6.4% | -6.5% |
| Short-Term Disability | 8.6% | 8.4% | 13.1% | 21.4% | 38.2% | 27.7% | 8.0% | 7.3% | 13.2% | 17.7% | 45.1% | 31.1% | -0.6% | -1.1% | 0.2% | -3.7% | 6.9% | 3.3% |
| Vision Plan | 8.2% | 11.1% | 17.1% | 32.2% | 57.9% | 41.2% | 7.4% | 12.6% | 20.0% | 35.4% | 61.4% | 44.3% | -0.8% | 1.4% | 2.9% | 3.2% | 3.5% | 3.0% |
| aThe difference is calculated as the simple difference between the 2008 and 2011 percentages. | ||||||||||||||||||
| Response Type | Survey Quarter | |||||||||
|---|---|---|---|---|---|---|---|---|---|---|
| 2011Q1 | 2011Q2 | 2011Q3 | 2011Q4 | Total | ||||||
| N | % (Gross) | N | % (Gross) | N | % (Gross) | N | % (Gross) | N | % (Gross) | |
| Total Surveys | 682 | 675 | 675 | 697 | 2,729 | |||||
| Responded, Operating (Gross Response Rate) | 504 | 73.9% | 503 | 74.5% | 505 | 74.8% | 519 | 74.5% | 2,031 | 74.4% |
| Insufficient Address Information | 16 | 2.3% | 3 | 0.4% | 10 | 1.5% | 12 | 1.7% | 41 | 1.5% |
| Refused | 23 | 3.4% | 35 | 5.2% | 14 | 2.1% | 14 | 2.0% | 86 | 3.2% |
| Temporarily Closed | 15 | 2.2% | 16 | 2.4% | 8 | 1.2% | 9 | 1.3% | 48 | 1.8% |
| Permanently Out of Business | 11 | 1.6% | 25 | 3.7% | 24 | 3.6% | 14 | 2.0% | 74 | 2.7% |
| No Employees During Reference Period | 26 | 3.8% | 28 | 4.1% | 28 | 4.1% | 33 | 4.7% | 115 | 4.2% |
| Net Usable Response Rates by Survey Quarter | ||||||||||
| Response Type | Survey Quarter | |||||||||
| 2011Q1 | 2011Q2 | 2011Q3 | 2011Q4 | Total | ||||||
| N | % (Net) | N | % (Net) | N | % (Net) | N | % (Net) | N | % (Net) | |
| Net Usable Surveys and Response Rate | 591 | 85.3% | 568 | 88.6% | 591 | 85.4% | 615 | 84.4% | 2,365 | 85.9% |
|
Employees Per Firm |
2008 | 2011 | Difference, 2008-2011 | |||
|---|---|---|---|---|---|---|
| N | % | N | % | N | % | |
| 1-4 | 19,290 | 7.0% | 18,940 | 7.2% | -350 | -1.8% |
| 5-9 | 25,586 | 9.3% | 24,149 | 9.2% | -1,437 | -5.6% |
| 10-19 | 31,628 | 11.6% | 31,309 | 11.9% | -318 | -1.0% |
| 20-49 | 43,514 | 15.9% | 39,167 | 14.9% | -4,347 | -10.0% |
| 50+ | 153,702 | 56.2% | 149,690 | 56.9% | -4,012 | -2.6% |
| Total | 273,720 | 100.0% | 263,254 | 100.0% | -10,466 | -3.8% |
| Industry | 2008 | 2011 |
Difference, 2008-2011 |
|||
|---|---|---|---|---|---|---|
| N | % | N | % | N | % | |
| Natural Resources & Mining | 28,420 | 10.4% | 27,213 | 10.3% | -1,207 | -4.2% |
| Construction | 28,311 | 10.3% | 21,032 | 8.0% | -7,279 | -25.7% |
| Manufacturing | 10,639 | 3.9% | 9,822 | 3.7% | -818 | -7.7% |
| Trade, Transportation, & Utilities | 53,240 | 19.5% | 49,928 | 19.0% | -3,311 | -6.2% |
| Information | 3,945 | 1.4% | 3,818 | 1.5% | -127 | -3.2% |
| Financial Activities | 11,441 | 4.2% | 10,510 | 4.0% | -931 | -8.1% |
| Professional & Business Services | 18,413 | 6.7% | 17,316 | 6.6% | -1,097 | -6.0% |
| Educational & Health Services | 55,229 | 20.2% | 59,785 | 22.7% | 4,556 | 8.2% |
| Leisure & Hospitality | 33,751 | 12.3% | 32,548 | 12.4% | -1,204 | -3.6% |
| Other Services | 7,800 | 2.8% | 7,708 | 2.9% | -92 | -1.2% |
| State & Local Government | 22,532 | 8.2% | 23,576 | 9.0% | 1,045 | 4.6% |
| Total | 273,720 | 100.0% | 263,254 | 100.0% | -10,466 | -3.8% |
| 2008 | 2011 | |||||||||||
|---|---|---|---|---|---|---|---|---|---|---|---|---|
| Number of Employees Per Firm | Number of Employees Per Firm | |||||||||||
| 1-4 | 5-9 | 10-19 | 20-49 | 50+ | Total | 1-4 | 5-9 | 10-19 | 20-49 | 50+ | Total | |
| Total Employment | 19,290 | 25,586 | 31,628 | 43,514 | 153,702 | 273,720 | 18,940 | 24,149 | 31,309 | 39,167 | 149,690 | 263,254 |
| Benefit Type | Number of Jobs Offered Benefits | Number of Jobs Offered Benefits | ||||||||||
| Child Care | 297 | 650 | 988 | 1,979 | 28,021 | 31,934 | 186 | 569 | 664 | 1,138 | 19,774 | 22,331 |
| Dental Plan | 3,122 | 5,276 | 9,699 | 21,778 | 108,824 | 148,700 | 3,133 | 5,856 | 10,060 | 17,383 | 109,416 | 145,849 |
| Dependent Health Insurance | 4,060 | 6,162 | 12,620 | 24,073 | 118,620 | 165,534 | 3,448 | 6,625 | 11,277 | 17,937 | 112,181 | 151,468 |
| Educational/Tuition Assist. | 3,644 | 5,324 | 6,630 | 11,595 | 87,882 | 115,075 | 3,121 | 4,120 | 7,110 | 11,116 | 85,350 | 110,816 |
| Flexible Spending Account | 1,276 | 2,226 | 4,429 | 11,047 | 94,142 | 113,120 | 1,676 | 2,175 | 4,393 | 8,977 | 92,918 | 110,139 |
| Health Insurance | 5,147 | 8,355 | 14,625 | 26,156 | 120,239 | 174,522 | 4,496 | 8,042 | 13,263 | 19,706 | 114,558 | 160,064 |
| Life Insurance | 3,057 | 5,207 | 9,090 | 22,554 | 116,089 | 155,996 | 2,748 | 4,783 | 9,230 | 17,269 | 108,204 | 142,234 |
| Long-Term Disability | 1,415 | 1,882 | 3,613 | 9,149 | 76,066 | 92,126 | 1,547 | 1,318 | 3,277 | 7,036 | 82,818 | 95,996 |
| Paid Holidays | 8,249 | 12,656 | 15,669 | 24,247 | 108,431 | 169,252 | 7,980 | 10,884 | 15,116 | 22,259 | 112,706 | 168,945 |
| Paid Personal Leave | 3,656 | 5,001 | 6,750 | 11,853 | 68,418 | 95,677 | 2,772 | 3,996 | 6,664 | 8,286 | 56,480 | 78,198 |
| Paid Sick Leave | 4,111 | 4,560 | 6,623 | 12,276 | 69,688 | 97,259 | 3,437 | 5,399 | 7,636 | 10,593 | 83,306 | 110,370 |
| Paid Vacation | 7,971 | 11,351 | 16,198 | 25,652 | 101,139 | 162,310 | 6,346 | 10,207 | 15,273 | 23,460 | 98,730 | 154,015 |
| Retirement Plan | 4,993 | 8,570 | 14,242 | 26,526 | 131,664 | 185,995 | 4,415 | 7,154 | 11,871 | 19,607 | 118,658 | 161,705 |
| Short-Term Disability | 1,651 | 2,151 | 4,136 | 9,326 | 58,690 | 75,954 | 1,511 | 1,764 | 4,147 | 6,942 | 67,478 | 81,842 |
| Vision Plan | 1,579 | 2,845 | 5,408 | 14,001 | 88,985 | 112,818 | 1,397 | 3,034 | 6,265 | 13,856 | 91,972 | 116,524 |
| 2008 |
Natural Res. & Mining |
Const. | Mfg. |
Trade, Transp., & Utilities |
Information | Financial Activities | Prof. & Business Services |
Educational & Health Services |
Leisure & Hospitality | Other Services | State & Local Gov't. | All Industries |
|---|---|---|---|---|---|---|---|---|---|---|---|---|
| Total Employment | 28,420 | 28,311 | 10,639 | 53,240 | 3,945 | 11,441 | 18,413 | 55,229 | 33,751 | 7,800 | 22,532 | 273,720 |
| Benefit Type | Number of Jobs Offered Benefits | |||||||||||
| Child Care | 9,380 | 2,205 | 50 | 3,062 | 5 | 363 | 729 | 12,273 | 3,768 | 8 | 91 | 31,934 |
| Dental Plan | 21,130 | 12,462 | 7,816 | 25,673 | 2,015 | 7,866 | 7,968 | 38,321 | 8,247 | 2,361 | 14,840 | 148,700 |
| Dependent Health Insurance | 26,213 | 15,201 | 8,335 | 29,712 | 2,071 | 7,749 | 9,350 | 39,306 | 7,686 | 2,568 | 17,344 | 165,534 |
| Educational/Tuition Assistance | 21,436 | 6,728 | 6,665 | 16,090 | 1,170 | 6,642 | 5,448 | 32,870 | 7,083 | 1,611 | 9,333 | 115,075 |
| Flexible Spending Account | 20,107 | 5,340 | 6,120 | 16,256 | 1,560 | 4,575 | 4,983 | 35,622 | 2,431 | 1,517 | 14,608 | 113,120 |
| Health Insurance | 26,058 | 16,313 | 8,804 | 31,749 | 2,242 | 8,348 | 10,621 | 40,841 | 9,045 | 3,047 | 17,456 | 174,522 |
| Life Insurance | 25,476 | 13,443 | 8,031 | 25,124 | 2,109 | 7,605 | 8,130 | 39,332 | 7,758 | 1,706 | 17,282 | 155,996 |
| Long-Term Disability | 18,866 | 3,054 | 4,544 | 7,909 | 1,260 | 5,929 | 5,106 | 31,656 | 1,807 | 1,755 | 10,238 | 92,126 |
| Paid Holidays | 22,804 | 15,057 | 9,414 | 32,552 | 2,449 | 9,573 | 13,179 | 31,007 | 8,623 | 4,488 | 20,105 | 169,252 |
| Paid Personal Leave | 5,594 | 8,828 | 4,387 | 12,398 | 1,490 | 4,259 | 5,587 | 39,351 | 6,142 | 1,120 | 6,522 | 95,677 |
| Paid Sick Leave | 5,529 | 3,352 | 4,857 | 17,474 | 1,217 | 5,666 | 5,426 | 31,431 | 4,558 | 1,823 | 15,925 | 97,259 |
| Paid Vacation | 25,985 | 14,341 | 8,518 | 33,285 | 1,672 | 6,995 | 9,792 | 27,288 | 14,159 | 4,254 | 16,021 | 162,310 |
| Retirement Plan | 24,958 | 17,915 | 8,495 | 32,433 | 2,326 | 8,369 | 11,604 | 49,025 | 9,803 | 2,844 | 18,224 | 185,995 |
| Short-Term Disability | 18,962 | 4,503 | 5,312 | 10,060 | 117 | 4,372 | 4,466 | 17,542 | 3,580 | 1,691 | 5,348 | 75,954 |
| Vision Plan | 18,173 | 6,578 | 5,334 | 19,101 | 1,855 | 6,830 | 6,563 | 27,701 | 3,833 | 1,567 | 15,283 | 112,818 |
| 2011 | Natural Resources & Mining | Construction | Manufacturing | Trade, Transp, & Utilities | Information | Financial Activities |
Prof. & Business Services |
Educational & Health Services |
Leisure & Hospitality | Other Services | State & Local Gov't. | All Industries |
|---|---|---|---|---|---|---|---|---|---|---|---|---|
| Total Employment | 27,213 | 21,032 | 9,822 | 49,928 | 3,818 | 10,510 | 17,316 | 59,785 | 32,548 | 7,708 | 23,576 | 263,254 |
| Benefit Type | Number of Jobs Offered Benefits | |||||||||||
| Child Care | 1,681 | 490 | 344 | 35 | 18 | 15 | 320 | 8,889 | 5,936 | 200 | 4,404 | 22,331 |
| Dental Plan | 22,892 | 9,230 | 6,898 | 23,550 | 2,074 | 6,595 | 6,699 | 41,024 | 5,432 | 2,702 | 18,754 | 145,849 |
| Dependent Health Insurance | 23,835 | 9,991 | 7,508 | 26,441 | 2,099 | 6,543 | 7,649 | 40,047 | 5,564 | 3,052 | 18,738 | 151,468 |
| Educational/Tuition Assistance | 20,517 | 5,546 | 6,445 | 16,296 | 539 | 4,722 | 4,863 | 33,036 | 4,495 | 1,009 | 13,348 | 110,816 |
| Flexible Spending Account | 19,389 | 3,576 | 5,320 | 12,442 | 820 | 5,107 | 4,274 | 38,792 | 5,560 | 1,610 | 13,248 | 110,139 |
| Health Insurance | 24,231 | 11,176 | 7,940 | 28,400 | 2,198 | 7,037 | 8,693 | 42,290 | 5,877 | 3,398 | 18,823 | 160,064 |
| Life Insurance | 23,078 | 8,894 | 7,488 | 22,751 | 1,580 | 6,217 | 6,649 | 39,258 | 4,783 | 2,734 | 18,803 | 142,234 |
| Long-Term Disability | 20,260 | 3,704 | 5,980 | 12,071 | 1,049 | 5,505 | 3,738 | 29,302 | 1,862 | 1,310 | 11,216 | 95,996 |
| Paid Holidays | 24,197 | 12,299 | 8,790 | 30,960 | 2,379 | 8,100 | 10,538 | 43,020 | 4,850 | 3,817 | 19,995 | 168,945 |
| Paid Personal Leave | 10,889 | 5,785 | 1,762 | 14,330 | 1,283 | 4,225 | 3,648 | 26,989 | 2,519 | 1,516 | 5,252 | 78,198 |
| Paid Sick Leave | 15,845 | 3,510 | 4,871 | 13,508 | 1,039 | 4,895 | 5,231 | 38,968 | 6,519 | 1,172 | 14,812 | 110,370 |
| Paid Vacation | 22,704 | 9,708 | 8,363 | 26,886 | 1,358 | 6,613 | 8,351 | 37,956 | 12,929 | 4,230 | 14,917 | 154,015 |
| Retirement Plan | 23,441 | 12,027 | 8,077 | 25,936 | 2,236 | 7,471 | 9,681 | 45,355 | 9,211 | 2,943 | 15,327 | 161,705 |
| Short-Term Disability | 19,523 | 4,738 | 5,736 | 10,854 | 1,156 | 4,646 | 3,593 | 21,186 | 2,372 | 1,694 | 6,345 | 81,842 |
| Vision Plan | 21,527 | 5,659 | 4,777 | 15,285 | 1,690 | 4,905 | 4,597 | 35,239 | 4,115 | 1,918 | 16,811 | 116,524 |
| Benefit Type | Full-Time | Part-Time |
|---|---|---|
| Child Care | 2.0% | 1.1% |
| Dental Plan | 30.7% | 5.3% |
| Dependent Health Insurance | 34.9% | 4.7% |
| Educational/Tuition Assistance | 22.9% | 9.4% |
| Flexible Spending Account | 11.4% | 2.4% |
| Health Insurance | 42.5% | 5.6% |
| Life Insurance | 27.7% | 4.0% |
| Long-Term Disability | 12.7% | 2.1% |
| Paid Holidays | 54.8% | 15.8% |
| Paid Personal Leave | 20.6% | 5.5% |
| Paid Sick Leave | 27.7% | 5.1% |
| Paid Vacation | 49.5% | 10.7% |
| Retirement Plan | 32.3% | 6.1% |
| Short-Term Disability | 13.4% | 2.4% |
| Vision Plan | 18.5% | 3.5% |
| Benefit Type | Number of Employees Per Firm | ||||
|---|---|---|---|---|---|
| 1-4 | 5-9 | 10-19 | 20-49 | 50+ | |
| Full-Time Employees | |||||
| Child Care | 1.2% | 3.1% | 2.0% | 3.6% | 13.4% |
| Dental Plan | 23.6% | 35.2% | 44.1% | 60.6% | 87.6% |
| Dependent Health Insurance | 26.0% | 40.5% | 49.6% | 63.4% | 90.6% |
| Educational/Tuition Assistance | 21.1% | 21.8% | 27.6% | 36.7% | 67.3% |
| Flexible Spending Account | 12.6% | 13.2% | 18.8% | 31.5% | 72.4% |
| Health Insurance | 33.9% | 49.0% | 58.3% | 69.8% | 91.8% |
| Life Insurance | 20.8% | 29.3% | 41.4% | 58.8% | 86.9% |
| Long-Term Disability | 11.8% | 8.0% | 14.7% | 24.5% | 67.3% |
| Paid Holidays | 54.8% | 62.0% | 62.2% | 72.1% | 88.5% |
| Paid Personal Leave | 18.6% | 23.2% | 26.9% | 28.0% | 41.9% |
| Paid Sick Leave | 24.7% | 31.2% | 32.5% | 36.2% | 63.4% |
| Paid Vacation | 45.2% | 59.5% | 63.5% | 76.1% | 78.9% |
| Retirement Plan | 31.3% | 40.2% | 50.1% | 66.5% | 88.6% |
| Short-Term Disability | 11.5% | 10.4% | 18.5% | 23.8% | 54.7% |
| Vision Plan | 10.7% | 18.6% | 27.8% | 48.7% | 73.4% |
| Part-Time Employees | |||||
| Child Care | 0.6% | 0.9% | 2.3% | 1.3% | 12.4% |
| Dental Plan | 1.5% | 2.2% | 3.3% | 4.4% | 17.5% |
| Dependent Health Insurance | 1.6% | 1.1% | 3.3% | 2.4% | 14.6% |
| Educational/Tuition Assistance | 6.6% | 7.5% | 11.0% | 7.9% | 17.7% |
| Flexible Spending Account | 0.8% | 0.6% | 2.5% | 1.6% | 22.4% |
| Health Insurance | 2.1% | 1.7% | 3.8% | 2.2% | 17.9% |
| Life Insurance | 1.2% | 0.6% | 0.9% | 7.8% | 16.1% |
| Long-Term Disability | 0.4% | 0.4% | 0.3% | 1.8% | 9.5% |
| Paid Holidays | 15.2% | 10.8% | 14.8% | 19.1% | 24.5% |
| Paid Personal Leave | 6.2% | 3.2% | 7.7% | 4.2% | 21.7% |
| Paid Sick Leave | 4.2% | 4.6% | 4.9% | 4.4% | 26.0% |
| Paid Vacation | 8.6% | 7.6% | 13.2% | 19.8% | 16.1% |
| Retirement Plan | 6.3% | 8.2% | 8.6% | 9.6% | 43.4% |
| Short-Term Disability | 0.4% | 1.1% | 0.5% | 2.6% | 8.2% |
| Vision Plan | 0.4% | 0.4% | 1.2% | 2.6% | 15.3% |
| Benefit Type | Number of Employees Per Firm |
Total Offering Benefits |
% of All Employers |
|||||||||
|---|---|---|---|---|---|---|---|---|---|---|---|---|
| 1-4 | % | 5-9 | % | 10-19 | % | 20-49 | % | 50+ | % | |||
| Full-Time Employees | Number and Percentage of Employers Offering Benefits | |||||||||||
| Child Care | 201 | 1.7% | 66 | 1.7% | 45 | 1.9% | 41 | 3.1% | 48 | 5.9% | 400 | 2.0% |
| Dental Plan | 2,558 | 22.2% | 1,183 | 29.8% | 1,037 | 43.2% | 726 | 54.8% | 650 | 81.0% | 6,154 | 30.7% |
| Dependent Health Ins. | 2,977 | 25.8% | 1,340 | 33.8% | 1,159 | 48.3% | 799 | 60.2% | 711 | 88.7% | 6,987 | 34.9% |
| Educational/Tuition Assist. | 2,355 | 20.4% | 822 | 20.7% | 617 | 25.7% | 398 | 30.0% | 387 | 48.3% | 4,579 | 22.9% |
| Flex.Spending Account | 1,070 | 9.3% | 255 | 6.4% | 262 | 10.9% | 308 | 23.2% | 381 | 47.4% | 2,275 | 11.4% |
| Health Insurance | 3,870 | 33.5% | 1,699 | 42.8% | 1,334 | 55.6% | 880 | 66.4% | 727 | 90.6% | 8,511 | 42.5% |
| Life Insurance | 2,294 | 19.9% | 1,004 | 25.3% | 886 | 36.9% | 729 | 54.9% | 633 | 78.9% | 5,546 | 27.7% |
| Long-Term Disability | 1,231 | 10.7% | 254 | 6.4% | 331 | 13.8% | 300 | 22.7% | 428 | 53.4% | 2,544 | 12.7% |
| Paid Holidays | 5,830 | 50.5% | 2,227 | 56.1% | 1,376 | 57.4% | 873 | 65.8% | 665 | 82.9% | 10,971 | 54.8% |
| Paid Personal Leave | 1,983 | 17.2% | 823 | 20.7% | 654 | 27.2% | 341 | 25.7% | 335 | 41.7% | 4,134 | 20.6% |
| Paid Sick Leave | 2,801 | 24.3% | 1,118 | 28.1% | 776 | 32.3% | 463 | 34.9% | 403 | 50.3% | 5,560 | 27.7% |
| Paid Vacation | 4,831 | 41.9% | 2,081 | 52.4% | 1,471 | 61.3% | 958 | 72.3% | 581 | 72.5% | 9,923 | 49.5% |
| Retirement Plan | 2,856 | 24.8% | 1,208 | 30.4% | 991 | 41.3% | 748 | 56.4% | 661 | 82.4% | 6,465 | 32.3% |
| Short-Term Disability | 1,290 | 11.2% | 336 | 8.5% | 374 | 15.6% | 299 | 22.6% | 385 | 48.0% | 2,685 | 13.4% |
| Vision Plan | 1,399 | 12.1% | 595 | 15.0% | 620 | 25.8% | 558 | 42.1% | 527 | 65.7% | 3,699 | 18.5% |
| Part-Time Employees | Number and Percentage of Employers Offering Benefits | |||||||||||
| Child Care | 94 | 0.8% | 30 | 0.5% | 32 | 1.8% | 20 | 2.0% | 53 | 4.2% | 230 | 1.1% |
| Dental Plan | 497 | 4.3% | 142 | 3.3% | 137 | 5.2% | 108 | 8.6% | 172 | 23.2% | 1,056 | 5.3% |
| Dependent Health Ins | 510 | 4.4% | 80 | 1.9% | 115 | 3.3% | 70 | 5.5% | 173 | 21.8% | 947 | 4.7% |
| Educational/Tuition Assist. | 1,025 | 8.9% | 259 | 11.3% | 288 | 11.1% | 181 | 11.5% | 130 | 28.5% | 1,883 | 9.4% |
| Flex. Spending Account | 205 | 1.8% | 33 | 2.2% | 77 | 2.3% | 33 | 7.1% | 128 | 21.2% | 475 | 2.4% |
| Health Insurance | 585 | 5.1% | 118 | 5.9% | 140 | 7.6% | 79 | 7.4% | 202 | 23.4% | 1,124 | 5.6% |
| Life Insurance | 335 | 2.9% | 57 | 2.6% | 70 | 4.8% | 143 | 9.4% | 190 | 21.5% | 795 | 4.0% |
| Long-Term Disability | 215 | 1.9% | 29 | 1.3% | 25 | 2.7% | 53 | 3.0% | 104 | 15.7% | 426 | 2.1% |
| Paid Holidays | 1,626 | 14.1% | 590 | 21.7% | 473 | 20.4% | 225 | 17.1% | 259 | 26.0% | 3,174 | 15.8% |
| Paid Personal Leave | 474 | 6.4% | 182 | 6.9% | 199 | 7.9% | 91 | 7.3% | 151 | 20.5% | 1,097 | 5.5% |
| Paid Sick Leave | 469 | 4.5% | 171 | 6.4% | 169 | 5.9% | 60 | 6.9% | 152 | 17.1% | 1,021 | 5.1% |
| Paid Vacation | 1,022 | 11.6% | 388 | 14.9% | 352 | 16.2% | 194 | 13.9% | 186 | 20.8% | 2,141 | 10.7% |
| Retirement Plan | 379 | 9.5% | 225 | 11.4% | 224 | 19.8% | 138 | 25.7% | 265 | 43.8% | 1,231 | 6.1% |
| Short-Term Disability | 215 | 0.3% | 68 | 1.9% | 44 | 3.5% | 47 | 2.9% | 107 | 11.0% | 481 | 2.4% |
| Vision Plan | 291 | 0.1% | 45 | 2.3% | 102 | 1.5% | 99 | 4.9% | 162 | 20.7% | 700 | 3.5% |
| Benefit Type | 2010 | 2011 |
Difference 2010-2011 |
|||
|---|---|---|---|---|---|---|
| Full-Time | Part-Time | Full-Time | Part-Time | Full-Time | Part-Time | |
| Child Care | 6.1% | 2.4% | 9.1% | 6.6% | 3.0% | 4.2% |
| Dental Plan | 67.7% | 11.4% | 70.5% | 9.9% | 2.8% | -1.5% |
| Dependent Health Ins. | 75.6% | 10.3% | 73.9% | 8.1% | -1.7% | -2.2% |
| Educational/Tuition Assist. | 49.2% | 19.8% | 51.8% | 12.8% | 2.6% | -7.0% |
| Flex. Spending Account | 48.5% | 15.1% | 51.9% | 9.7% | 3.4% | -5.3% |
| Health Insurance | 80.0% | 11.4% | 77.7% | 1.7% | -2.3% | -9.7% |
| Life Insurance | 69.8% | 11.7% | 68.8% | 4.9% | -1.0% | -6.8% |
| Long-Term Disability | 40.5% | 6.1% | 46.9% | 19.1% | 6.3% | 13.1% |
| Paid Holidays | 77.6% | 22.3% | 78.9% | 19.7% | 1.2% | -2.6% |
| Paid Personal Leave | 44.9% | 11.7% | 35.2% | 13.0% | -9.7% | 1.3% |
| Paid Sick Leave | 47.8% | 13.7% | 50.9% | 14.7% | 3.1% | 0.9% |
| Paid Vacation | 79.4% | 21.8% | 73.0% | 14.6% | -6.4% | -7.2% |
| Retirement Plan | 76.5% | 27.9% | 73.5% | 25.0% | -3.0% | -3.0% |
| Short-Term Disability | 30.2% | 4.9% | 39.9% | 4.6% | 9.7% | -0.3% |
| Vision Plan | 55.9% | 9.2% | 56.3% | 7.9% | 0.4% | -1.2% |
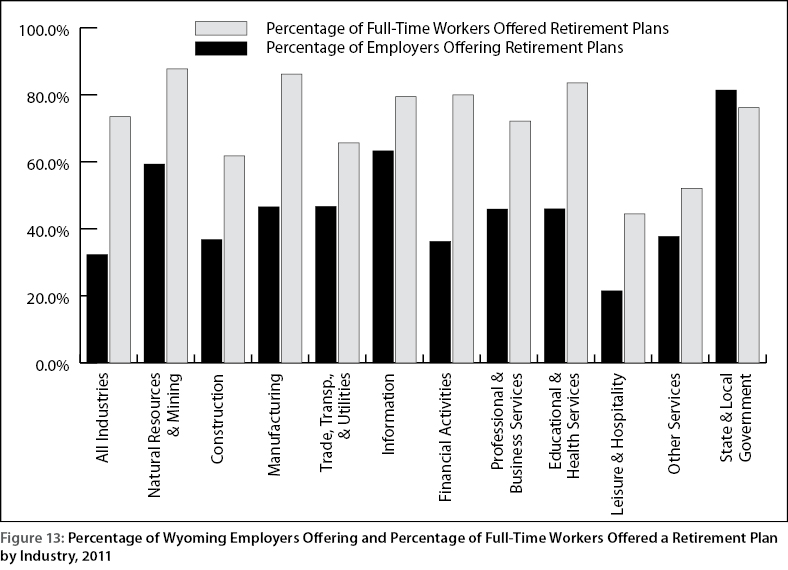
| Benefit Type | All Industries | Natural Resources & Mining | Const. | Mfg. | Trade, Transp., & Utilities | Information | Financial Activities | Prof. & Business Services | Educational & Health Services | Leisure & Hospitality | Other Services | State & Local Gov't. |
|---|---|---|---|---|---|---|---|---|---|---|---|---|
| Full-Time Employees | ||||||||||||
| Child Care | 9.1% | 6.3% | 2.4% | 3.5% | 0.1% | 0.5% | 0.2% | 2.7% | 16.1% | 24.9% | 3.8% | 21.6% |
| Dental Plan | 70.5% | 86.0% | 47.6% | 74.2% | 62.9% | 81.7% | 73.2% | 52.9% | 84.6% | 31.6% | 50.5% | 96.5% |
| Dependent Health Ins. | 73.9% | 89.5% | 51.5% | 80.8% | 71.1% | 83.5% | 73.7% | 61.9% | 84.3% | 32.5% | 57.2% | 96.6% |
| Educational/Tuition Assist. | 51.8% | 76.8% | 28.0% | 68.5% | 44.0% | 21.4% | 51.1% | 36.8% | 64.1% | 17.0% | 17.6% | 69.7% |
| Flex. Spending Account | 51.9% | 72.7% | 18.4% | 57.1% | 34.5% | 32.3% | 55.9% | 34.7% | 75.0% | 32.2% | 30.1% | 66.5% |
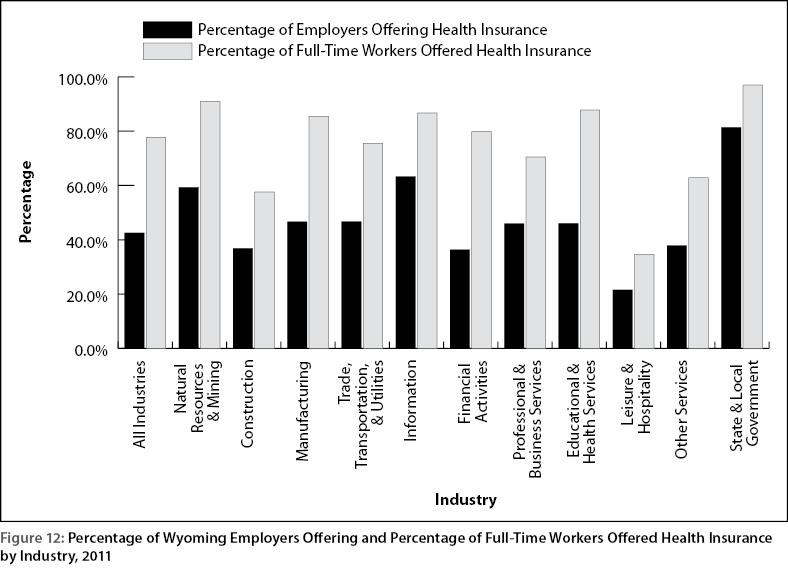
| Health Insurance | 77.7% | 91.0% | 57.6% | 85.5% | 75.5% | 86.7% | 79.9% | 70.5% | 87.8% | 34.6% | 62.8% | 97.0% |
| Life Insurance | 68.8% | 86.6% | 45.8% | 80.6% | 60.3% | 61.1% | 70.1% | 52.9% | 81.4% | 29.1% | 50.7% | 95.6% |
| Long-Term Disability | 46.9% | 76.1% | 19.1% | 64.8% | 33.7% | 41.9% | 64.0% | 28.9% | 60.7% | 11.8% | 24.5% | 56.8% |
| Paid Holidays | 78.9% | 90.7% | 62.8% | 93.9% | 80.3% | 93.1% | 89.3% | 79.3% | 84.4% | 19.9% | 66.3% | 99.5% |
| Paid Personal Leave | 35.2% | 40.6% | 29.7% | 19.0% | 40.0% | 50.7% | 44.3% | 27.7% | 45.9% | 11.4% | 24.2% | 27.9% |
| Paid Sick Leave | 50.9% | 59.4% | 17.9% | 52.6% | 35.3% | 41.7% | 53.9% | 41.6% | 72.6% | 40.9% | 20.5% | 73.0% |
| Paid Vacation | 73.0% | 85.0% | 50.0% | 89.9% | 73.3% | 53.0% | 72.3% | 63.7% | 78.0% | 66.1% | 74.0% | 73.5% |
| Retirement Plan | 73.5% | 87.8% | 61.8% | 86.2% | 65.7% | 79.5% | 80.0% | 72.2% | 83.6% | 44.5% | 52.1% | 76.2% |
| Short-Term Disability | 39.9% | 73.3% | 24.5% | 62.1% | 30.3% | 44.1% | 54.0% | 27.1% | 42.9% | 14.7% | 31.7% | 32.2% |
| Vision Plan | 56.3% | 80.8% | 29.1% | 51.3% | 42.1% | 67.6% | 56.0% | 37.2% | 71.8% | 22.2% | 35.6% | 86.2% |
| Part-Time Employees | ||||||||||||
| Child Care | 6.6% | 2.3% | 1.2% | 3.1% | 0.0% | 0.3% | 0.0% | 0.0% | 11.4% | 12.4% | 0.0% | 7.2% |
| Dental Plan | 9.9% | 5.8% | 1.7% | 7.4% | 7.4% | 2.8% | 17.7% | 6.3% | 21.9% | 3.8% | 0.8% | 12.2% |
| Dependent Health Ins. | 8.1% | 5.3% | 1.9% | 7.4% | 7.1% | 1.4% | 13.0% | 4.0% | 16.2% | 3.7% | 0.4% | 11.7% |
| Educational/Tuition Assist. | 12.8% | 15.5% | 7.9% | 20.5% | 3.9% | 0.4% | 18.2% | 8.3% | 29.2% | 11.1% | 3.0% | 4.6% |
| Flex. Spending Account | 9.7% | 9.2% | 0.9% | 7.4% | 0.6% | 1.1% | 17.0% | 1.8% | 35.3% | 4.0% | 0.4% | 15.3% |
| Health Insurance | 9.7% | 6.5% | 2.0% | 7.4% | 9.8% | 2.8% | 11.2% | 4.0% | 20.6% | 3.7% | 2.4% | 11.8% |
| Life Insurance | 9.3% | 6.8% | 1.9% | 7.4% | 8.3% | 4.3% | 12.2% | 5.3% | 19.4% | 2.3% | 1.7% | 17.0% |
| Long-Term Disability | 4.9% | 5.8% | 0.2% | 0.0% | 0.2% | 0.4% | 2.2% | 5.0% | 14.7% | 0.5% | 0.4% | 10.9% |
| Paid Holidays | 19.7% | 13.9% | 9.1% | 20.0% | 15.6% | 4.4% | 24.4% | 18.9% | 35.5% | 10.6% | 12.2% | 26.3% |
| Paid Personal Leave | 13.0% | 15.6% | 2.2% | 0.5% | 0.2% | 1.4% | 22.5% | 6.1% | 43.0% | 4.5% | 9.5% | 0.1% |
| Paid Sick Leave | 14.7% | 9.0% | 2.7% | 1.6% | 6.1% | 0.0% | 15.3% | 4.3% | 43.4% | 2.0% | 3.5% | 22.6% |
| Paid Vacation | 14.6% | 17.2% | 2.5% | 10.9% | 4.7% | 2.6% | 22.5% | 12.9% | 20.9% | 16.9% | 12.5% | 22.9% |
| Retirement Plan | 25.0% | 17.2% | 3.7% | 19.6% | 17.0% | 19.1% | 32.9% | 18.9% | 53.1% | 14.3% | 7.3% | 20.7% |
| Short-Term Disability | 4.6% | 5.8% | 0.2% | 0.0% | 0.2% | 4.3% | 2.3% | 6.4% | 13.6% | 0.8% | 0.4% | 5.8% |
| Vision Plan | 7.9% | 5.8% | 2.1% | 7.4% | 1.7% | 0.4% | 6.7% | 2.2% | 21.2% | 4.3% | 1.2% | 12.2% |
| Retirement Plan Type | All Industries | Natural Resources & Mining | Const. | Mfg. | Trade, Transp., & Utilities | Information | Financial Activities | Prof. & Business Services | Educational & Health Services | Leisure & Hospitality | Other Services | State & Local Gov't. |
|---|---|---|---|---|---|---|---|---|---|---|---|---|
| Full-Time Employees | ||||||||||||
| Defined-Contribution Plan | 84.3% | 99.3% | 95.1% | 95.0% | 95.5% | 99.2% | 95.7% | 93.1% | 72.8% | 99.1% | 96.0% | 66.2% |
| Employer Paid Only | 8.1% | 0.5% | 6.5% | 23.5% | 9.3% | 15.0% | 15.5% | 14.5% | 7.9% | 0.6% | 6.3% | 6.5% |
| Employee Paid Only | 14.2% | 0.6% | 14.2% | 15.9% | 10.7% | 7.8% | 12.5% | 11.7% | 17.0% | 0.0% | 34.4% | 49.7% |
| Paid Jointly | 77.7% | 98.9% | 79.3% | 60.6% | 80.0% | 77.3% | 72.0% | 73.8% | 75.1% | 99.4% | 59.2% | 43.8% |
| Defined-Benefit Plan | 26.0% | 22.6% | 4.9% | 10.5% | 16.7% | 0.8% | 10.7% | 6.9% | 43.0% | 0.9% | 4.0% | 67.3% |
| Employer Paid Only | 49.8% | 98.8% | 100.0% | 100.0% | 70.9% | 0.0% | 100.0% | 46.4% | 21.2% | 0.0% | 100.0% | 50.7% |
| Employee Paid Only | 3.3% | 0.0% | 0.0% | 0.0% | 0.0% | 0.0% | 0.0% | 0.0% | 7.3% | 0.0% | 0.0% | 0.9% |
| Paid Jointly | 46.9% | 1.2% | 0.0% | 0.0% | 29.1% | 100.0% | 0.0% | 53.6% | 71.5% | 100.0% | 0.0% | 48.4% |
| Part-Time Employees | ||||||||||||
| Defined-Contribution Plan | 79.6% | 100.0% | 100.0% | 100.0% | 88.9% | 100.0% | 97.7% | 100.0% | 67.5% | 100.0% | 100.0% | 74.1% |
| Employer Paid Only | 8.6% | 0.0% | 47.8% | 0.0% | 0.0% | 0.0% | 20.3% | 28.0% | 5.3% | 2.1% | 55.2% | 36.2% |
| Employee Paid Only | 30.4% | 0.0% | 0.0% | 2.6% | 54.3% | 0.0% | 26.5% | 4.0% | 43.3% | 0.0% | 0.0% | 27.8% |
| Paid Jointly | 61.0% | 100.0% | 52.2% | 97.4% | 45.7% | 100.0% | 53.2% | 68.0% | 51.4% | 97.9% | 44.8% | 36.0% |
| Defined-Benefit Plan | 20.4% | 0.0% | 0.0% | 0.0% | 11.1% | 0.0% | 2.3% | 0.0% | 32.5% | 0.0% | 0.0% | 42.5% |
| Employer Paid Only | 15.8% | 0.0% | 0.0% | 0.0% | 19.2% | 0.0% | 100.0% | 0.0% | 11.7% | 0.0% | 0.0% | 36.3% |
| Employee Paid Only | 9.2% | 0.0% | 0.0% | 0.0% | 0.0% | 0.0% | 0.0% | 0.0% | 11.6% | 0.0% | 0.0% | 0.0% |
| Paid Jointly | 75.0% | 0.0% | 0.0% | 0.0% | 80.8% | 0.0% | 0.0% | 0.0% | 76.7% | 0.0% | 0.0% | 63.7% |
| Note: Percentages may not add to 100.0% due to rounding. | ||||||||||||
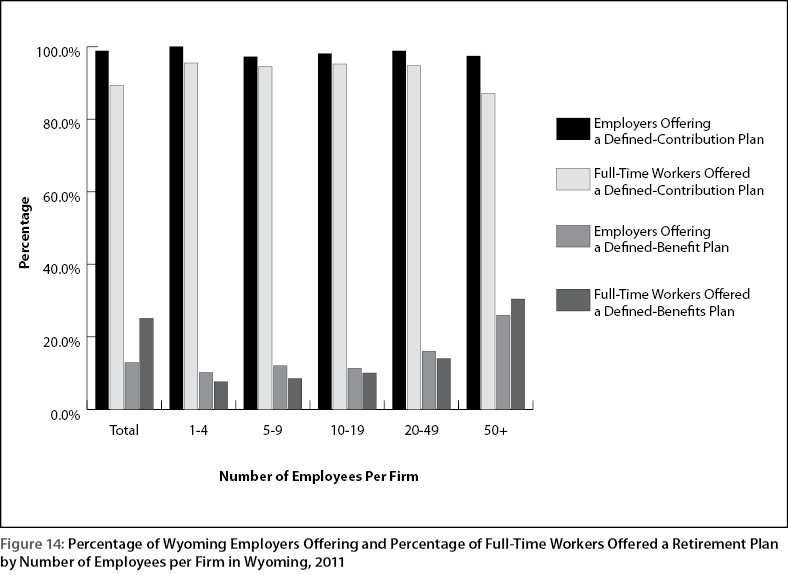
| Retirement Plan Type | Number of Employees per Firm | |||||
|---|---|---|---|---|---|---|
| Total | 1-4 | 5-9 | 10-19 | 20-49 | 50+ | |
| Full-Time Employees | ||||||
| Defined-Contribution Plan | 84.3% | 92.0% | 91.0% | 91.4% | 92.1% | 81.8% |
| Employer Paid Only | 8.1% | 21.8% | 15.1% | 11.1% | 4.7% | 7.4% |
| Employee Paid Only | 14.2% | 10.0% | 11.1% | 9.2% | 13.7% | 15.2% |
| Paid Jointly | 77.7% | 68.2% | 73.8% | 79.7% | 81.6% | 77.3% |
| Defined-Benefit Plan | 26.0% | 8.0% | 9.0% | 8.4% | 13.2% | 31.8% |
| Employer Paid Only | 49.8% | 65.3% | 83.6% | 65.2% | 75.8% | 46.7% |
| Employee Paid Only | 3.3% | 0.0% | 0.0% | 0.0% | 3.6% | 3.5% |
| Paid Jointly | 46.9% | 34.7% | 16.4% | 34.8% | 20.6% | 49.8% |
| Part-Time Employees | ||||||
| Defined-Contribution Plan | 79.6% | 100.0% | 97.4% | 97.9% | 87.5% | 77.5% |
| Employer Paid Only | 8.6% | 24.0% | 27.9% | 3.1% | 0.0% | 8.2% |
| Employee Paid Only | 30.4% | 3.3% | 0.9% | 1.8% | 36.4% | 34.4% |
| Paid Jointly | 61.0% | 72.7% | 71.2% | 95.2% | 63.6% | 57.4% |
| Defined-Benefit Plan | 20.4% | 0.0% | 2.6% | 2.1% | 27.2% | 22.5% |
| Employer Paid Only | 15.8% | 0.0% | 33.3% | 0.0% | 62.6% | 11.2% |
| Employee Paid Only | 9.2% | 0.0% | 0.0% | 0.0% | 0.0% | 10.1% |
| Paid Jointly | 75.0% | 0.0% | 66.7% | 100.0% | 37.4% | 78.6% |
| Note: Totals may not add to 100.0% due to rounding. | ||||||
| Enrolled Benefit | Full-Time | Part-Time |
|---|---|---|
| Dental Plan | 74.7% | 30.0% |
| Dependent Health Insurance | 49.0% | 21.9% |
| Health Insurance | 73.1% | 33.9% |
| Life Insurance | 85.0% | 40.8% |
| Long-term Disability | 77.9% | 64.9% |
| Retirement Plan, Defined-Contribution | 60.8% | 37.8% |
| Retirement Plan, Defined-Benefit | 79.5% | 71.8% |
| Short-term Disability | 59.3% | 12.2% |
| Vision Plan | 68.1% | 25.2% |
| Enrolled Benefit | Full-Time | Part-Time |
|---|---|---|
| Dental Plan | -3.0% | -7.3% |
| Dependent Health Insurance | -1.2% | 4.1% |
| Health Insurance | -5.0% | -0.5% |
| Life Insurance | -0.9% | -20.1% |
| Long-term Disability | 1.6% | 18.2% |
| Retirement Plan, Defined-Contribution | -5.1% | -0.2% |
| Retirement Plan, Defined-Benefit | -13.3% | -26.3% |
| Short-term Disability | -16.9% | -50.6% |
| Vision Plan | -2.5% | -1.3% |
| Employer Paid | Employee Paid | Jointly Paid | ||||
|---|---|---|---|---|---|---|
| Full-Time | Part-Time | Full-Time | Part-Time | Full-Time | Part-Time | |
| Dental Plan | 40.2% | 30.7% | 15.1% | 24.7% | 44.7% | 44.6% |
| Dependent Health Insurance | 21.5% | 23.2% | 31.1% | 33.0% | 47.4% | 43.9% |
| Health Insurance | 48.1% | 38.8% | 0.9% | 13.6% | 50.9% | 47.6% |
| Life Insurance | 68.6% | 59.8% | 8.3% | 14.8% | 23.1% | 25.4% |
| Long-term Disability | 65.7% | 42.0% | 21.3% | 34.2% | 13.0% | 23.8% |
| Short-term Disability | 53.5% | 33.0% | 33.5% | 51.2% | 13.0% | 15.9% |
| Vision Plan | 31.5% | 13.1% | 24.9% | 40.6% | 43.6% | 46.2% |
| Full-Time | Part-Time | |||
|---|---|---|---|---|
| Mean | Modea | Mean | Modea | |
| Paid Holidays | 7.1 | 6 | 7.1 | 6 |
| Paid Sick Leave | 7.9 | 5 | 6.9 | 3 |
| Paid Vacation (After 1 Year) | 7.7 | 5 | 6.4 | 5 |
| Paid Vacation (After 5 Years) | 11.8 | 10 | 9.7 | 5 |
| Paid Vacation (After 10 Years) | 14.2 | 15 | 11.3 | 5 |
| Paid Personal Leave (After 1 Year) | 8.5 | 5 | 7.2 | 5 |
| Paid Personal Leave (After 5 Years) | 11.8 | 10 | 9.4 | 10 |
| Paid Personal Leave (After 10 Years) | 13.8 | 10 | 11.0 | 5 |
| aMode represents the value appearing most frequently in a given data set. | ||||