Wyoming Earnings by Age, Gender, Industry, and County
Information on earnings within age, gender, industry, and county categories is now available online from Research & Planning. These data were collected using a variety of methods, including the Quarterly Census of Employment and Wages (QCEW), Current Employment Statistics (CES), Unemployment Insurance (UI) Wage Records, and driver’s license records.
These figures were constructed using a sample of the information available online.
Figure 1 shows that in 1992, women earned an average annual wage of 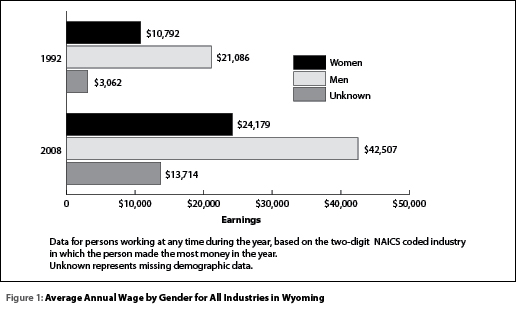 $10,792 and accounted for 42.8% of Wyoming’s workforce. Men, on the other hand, earned an average wage of $21,086 and accounted for 47.4% of the state’s workforce. Note that the gender of an additional 9.8% of Wyoming’s workforce is unknown because of missing demographic data.
By 2008, women earned an average annual wage of $24,179 while accounting for 36.6% of the workforce. The average wage for men in 2008 increased to $42,507, while they made up 43.5% of the workforce. Note, however, that the gender of the remaining 19.9% of the workforce is unknown because of missing demographic data. These data also indicate that the average annual wage for women increased at a greater rate from 1992 to 2008 (124.05%) than the average annual wage for men (101.59%).
Figure 2 shows the average annual wage for men and women in 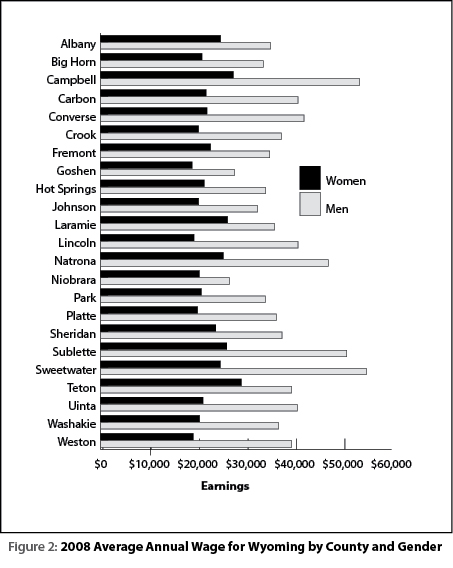 Wyoming by county in 2008. Sweetwater County ($54,831) had the highest average annual wage for men, followed by Campbell County ($53,471). Teton County ($29,027) had the highest average annual wage for women, followed by Campbell County ($27,372).
Figure 3 shows the distribution of employees by age group in the 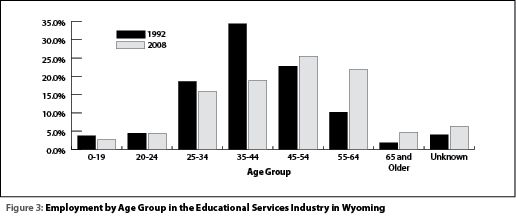 educational services industry, which had an older population of workers than any other industry in 2008. In 1992 workers in the 35-44 age range accounted for 34.3% of all employees in this industry. In 2008 that percentage had decreased to 18.9%. By 2008 52.0% of all educational services employees were 45 or older, compared to 34.8% in 1992.