Covered Employment and Wages for Fourth Quarter 2009: Total Payroll Declines in 16 Wyoming Counties
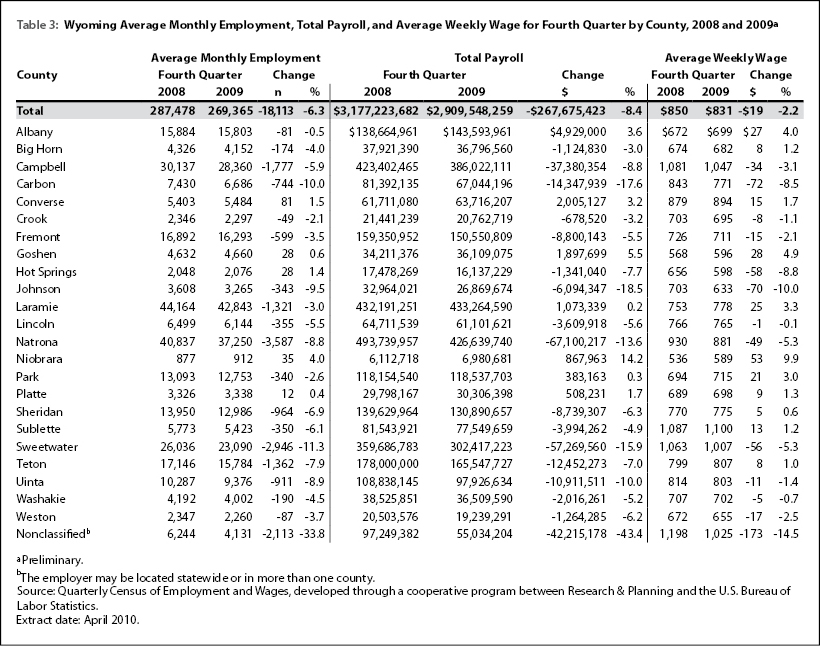
Total payroll decreased in 16 of the state's 23 counties, while employment decreased in 18 counties and increased in 5. Most of the counties that saw increases in total payroll or employment were in the southeast region of the state.
From fourth quarter 2008 to fourth quarter 2009, total unemployment insurance (UI) covered payroll decreased by $267.7 million (-8.4%). UI covered payroll represents approximately 92% of all wage and salary disbursements and 45% of personal income in the state (U.S. Bureau of Economic Analysis, 2007). Total payroll decreased in 16 of the state's 23 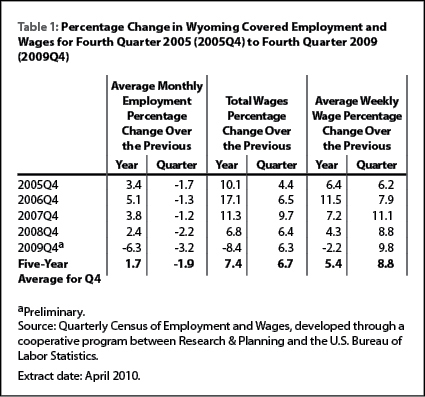 counties. Table 1 shows that employment, payroll, and average weekly wage all grew at rates substantially lower than their five-year averages.
  Total payroll is an important economic indicator because it is often associated with consumer spending, retail sales, and sales tax revenue (Black & Evans, 1997).
The covered payroll and employment data in this article are measured by place of work, in contrast to the labor force estimates, which are a measure of employed and unemployed persons by place of residence. Also, the employment data presented in this article represent a count of jobs, not persons. When individuals work more than one job, each is counted separately.
The Figure shows that the large increases in total payroll during 2005, 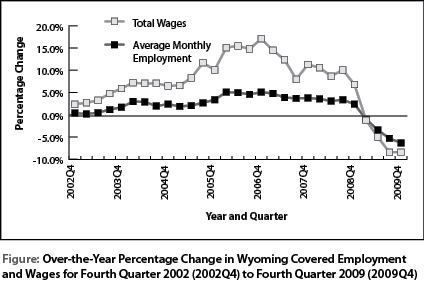 2006, and 2007 were nearly mirrored by large decreases in 2009. Similarly, job growth, which peaked at 5.1% in 2006, turned sharply negative in 2009 (see Table 2).
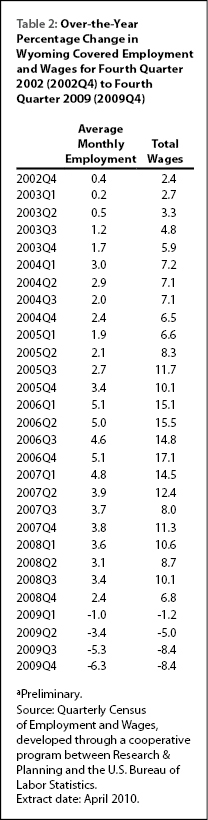
The purpose of this article is to show employment and payroll changes between fourth quarter 2008 and fourth quarter 2009. These economic changes help gauge the overall strength of Wyoming's economy and identify the fastest and slowest growing sectors and geographic areas.
Employment and Wages by County
Table 3 shows that employment increased in 5 counties and decreased in the other 18. Three of the 5 counties where employment grew were located in the southeast region of the state. Additionally, 5 of the 7 counties where total payroll increased were found in the southeast region.
Converse County added 81 jobs (1.5%) and its total payroll increased by $2.0 million (3.2%). Job gains were seen in construction, transportation & warehousing, local government (including public schools), and health care & social assistance. Employment decreased in retail trade, professional & technical services, and accommodation & food services.
In Niobrara County, employment increased by 35 jobs (4.0%) and total payroll rose by $0.9 million (14.2%). Small job gains were seen in local government and other services.
Hot Springs County gained 28 jobs (1.4%), but its total payroll decreased by $1.3 million (-7.7%). Employment increased in local government (including public schools) and health care & social assistance. Job losses were seen in construction.
Goshen County added 28 jobs (0.6%) and its total payroll increased by $1.9 million (5.5%). Job gains were seen in state government (nearly 200 jobs), agriculture, and health care & social assistance. Employment fell in construction (more than 100 jobs), administrative & waste services, retail trade, and manufacturing.
Platte County's employment grew by 12 jobs (0.4%) and its total payroll rose by $0.5 million (1.7%). Modest job gains in agriculture, manufacturing, and local government were mostly offset by job losses in mining, construction, and retail trade.
Sweetwater County lost 2,946 jobs (-11.3%) and its total payroll decreased by $57.3 million (-15.9%). The largest job losses occurred in mining (including oil & gas; approximately 1,150 jobs) and construction (nearly 700 jobs). Employment also fell in transportation & warehousing (more than 250 jobs).
Campbell County's total employment fell by 1,777 jobs (-5.9%) and its total payroll decreased by $37.4 million (-8.8%). Employment declined sharply in mining (including oil & gas; approximately 700 jobs) and construction (approximately 600 jobs). Job losses were also seen in retail trade (more than 100 jobs) and transportation & warehousing (approximately 100 jobs).
In Teton County, employment decreased by 1,362 jobs (-7.9%) and total payroll fell by $12.5 million (-7.0%). The largest job losses were in construction (more than 550 jobs) and smaller job losses were seen in accommodation & food services (more than 150 jobs), retail trade (approximately 150 jobs), professional & technical services (more than 100 jobs), and administrative & waste services (approximately 100 jobs).
Sheridan County lost 964 jobs (-6.9%) and its total payroll fell by $8.7 million (-6.3%). Employment fell in construction (approximately 250 jobs), mining (approximately 250 jobs), retail trade (approximately 150 jobs), manufacturing (more than 100 jobs), and health care & social assistance (approximately 100 jobs).
Uinta County's employment decreased by 911 jobs (-8.9%) and its total payroll fell by $10.9 million (-10.0%). Notable job losses occurred in construction (nearly 400 jobs), mining (including oil & gas; nearly 200 jobs), and retail trade (approximately 100 jobs).
Table 4 shows that Natrona County lost 3,587 jobs (-8.8%). Its decrease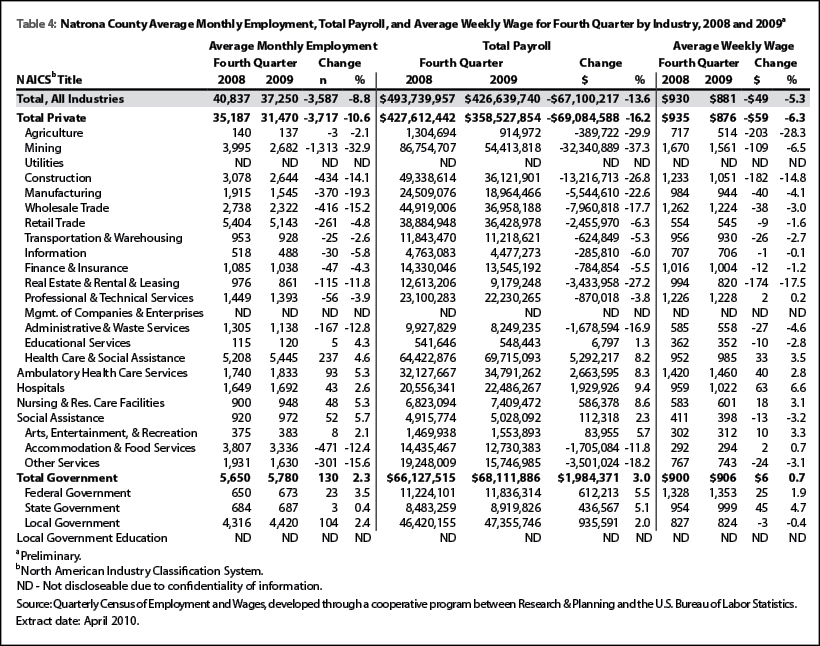 in total payroll of $67.1 million (-13.6%) was the largest of any county. Substantial job losses occurred in mining (including oil & gas; -1,313 jobs, or -32.9%), accommodation & food services (-471 jobs, or -12.4%), construction (-434 jobs, or -14.1%), wholesale trade (-416 jobs, or -15.2%), and manufacturing (-370 jobs, or -19.3%).
Laramie County's employment fell by 1,321 jobs (-3.0%), but its total payroll grew by $1.1 million (0.2%; see Table 5). Large job losses were seen in retail trade (-422 jobs, or -7.4%), accommodation & food services (-238 jobs, or -5.6%), construction (-221 jobs, or -7.3%), and manufacturing (-170 jobs, or -10.4%). Job growth occurred in federal government (90 jobs, or 3.4%), health care & social assistance (49 jobs, or 1.3%), and local government (45 jobs, or 0.6%).
Statewide Employment and Wages by Industry
Large job losses continued in mining, construction, retail trade,  accommodation & food services, manufacturing, and professional & technical services (see Table 6). Employment and total payroll increased in local government, health care & social assistance, state government, and federal government.
Mining employment fell by 6,251 jobs (-20.6%) and its total payroll decreased by $138.1 million (-23.2%). The most notable job losses occurred in support activities for mining (nearly 5,200 jobs), but employment also decreased in oil & gas extraction (approximately 700 jobs) and mining, except oil & gas (approximately 350 jobs).
Construction lost 4,683 jobs (-16.8%) and its total payroll fell by $81.8 million (-22.3%). Sizeable job losses were seen in all three subsectors. Construction of buildings lost approximately 700 jobs, heavy & civil engineering construction lost nearly 1,800 jobs, and specialty trade contractors lost more than 2,150 jobs.
Retail trade lost 2,012 jobs (-6.2%) and its total payroll decreased by $10.6 million (-5.0%). Large employment decreases were seen in motor vehicle & parts dealers (approximately 350 jobs), building material & garden supply stores (more than 300 jobs), gasoline stations (more than 400 jobs), and nonstore retailers (more than 300 jobs). Smaller job losses occurred in furniture & home furnishings stores (approximately 100 jobs), clothing & clothing accessories stores (more than 100 jobs), sporting goods, hobby, book, & music stores (approximately 100 jobs), and miscellaneous store retailers (approximately 150 jobs).
Employment in accommodation & food services decreased by 1,914 jobs (-6.4%) and its total payroll fell by $8.5 million (-7.0%). Job losses were about evenly split between accommodation (approximately 900 jobs) and food services & drinking places (approximately 1,000 jobs).
Manufacturing employment fell by 1,059 jobs (-10.4%) and its total payroll decreased by $9.9 million (-7.5%). Job losses were seen in many subsectors, including fabricated metal product manufacturing (more than 300 jobs), wood product manufacturing (nearly 200 jobs), plastics & rubber products manufacturing (approximately 150 jobs), and chemical manufacturing (nearly 150 jobs).
Employment in professional & technical services decreased by 955 jobs (-9.6%) and its total payroll fell by $10.5 million (-7.2%). Large job losses occurred in architectural & engineering services (nearly 400 jobs), other professional & technical services (nearly 300 jobs), computer systems design & related services (approximately 100 jobs), and management & technical consulting services (approximately 100 jobs).
Local government added 1,186 jobs (2.7%) and its total payroll increased by $22.4 million (5.1%). A large part of the increase in jobs was in local government education (including public schools and colleges) which gained 895 jobs (3.8%). Employment in public administration (including cities, towns, and counties) increased by more than 150 jobs.
Health care & social assistance gained 705 jobs (3.1%) and its total payroll grew by $13.3 million (5.7%). Social assistance added the most jobs (394, or 6.2%) followed by ambulatory health care services (273 jobs, or 3.3%).
State government employment increased by 341 jobs (2.6%) and its total payroll increased by $7.1 million (4.5%). However, almost all of the job growth was in state government education (318 jobs, or 9.1%).
Federal government added 216 jobs (3.0%) and its total payroll grew by $5.1 million (4.6%). Hospitals gained nearly 100 jobs, and growth was also seen in administration of environmental quality programs and administration of economic programs. Employment decreased by nearly 100 jobs in postal service.
In summary, job losses grew larger in fourth quarter and affected most industry sectors and most areas of the state.
For more information, contact David Bullard at (307) 473-3810 or dbulla@state.wy.us.
References
Black, D. & Evans, M. (1997, May). Work, pay and consumer spending, part one: Sales tax collections and total payroll. Wyoming Labor Force Trends, 34(5), Retrieved September 11, 2008, from http://doe.state.wy.us/LMI/0597/0597a2.htm
U.S. Bureau of Economic Analysis. (2007, May 15). SA04 State income and employment summary — Wyoming. Retrieved May 15, 2007, from http://www.bea.gov/regional/spi/default.cfm
U.S. Census Bureau. (2007, August 28). 2007 NAICS codes and titles. Retrieved September 20, 2007, from http://www.census.gov/naics/2007/NAICOD07.HTM