Inside the OES: Occupations and Wages in Wyoming
Wyoming's average annual wage across all 22 major occupational groups in 2009 was $40,381. The management occupations group had the highest annual average wage ($78,506), while food preparation & serving related occupations had the lowest ($20,520).
An estimated 8,120 people in Wyoming worked as retail salespersons in 2009, more than in any other occupation, according to the Occupational Employment Statistics (OES) Wage Survey. These workers earned an average annual wage of $23,921, or $11.50 per hour, the survey found.
In Wyoming, roughly 1 in 35 people worked as a retail salesperson in 2009. The occupation was also the largest detailed occupation nationally in 2009 with nearly 3.9 million workers, according to the Bureau of Labor Statistics (2009).
The two largest major groups, office &  administrative support occupations and construction & extraction occupations, represented more than one-fourth of all occupations in the state, at 13.6% and 12.9%, respectively (see Figure 1). Third and fourth were transportation & material moving occupations (8.8%) and food preparation & serving-related occupations (8.6%).
The second largest occupation in the state was 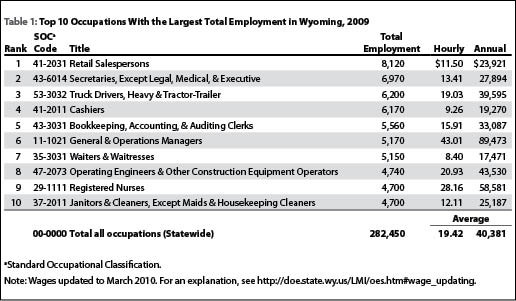 secretaries, except legal, medical, & executive, with an estimated 6,970 workers, followed by truck drivers, heavy & tractor trailer, with 6,200. The top 10 occupations with the largest total employment accounted for an estimated 57,480 jobs, or 20.4% of all jobs in the state (see Table 1).
Retail salespersons was the occupation with the largest total employment in the Casper and Cheyenne metropolitan statistical areas (MSAs) and the Northwest Region (see Tables 2-7). In the Central-Southeast Region, the largest single occupation was secretaries, except legal, medical, & executive. In the Northeast Region, operating engineers & other construction equipment operators led the list of largest total employment by a large margin with 2,550 workers, compared to 1,350 workers in the next-largest occupation, secretaries, except legal, medical, & executive. Truck drivers, heavy & tractor-trailer, led the list in the Southwest Region.
Twelve of the 22 major  occupational groups had an estimated average annual wage higher than the statewide average of $40,381 (see Figure 2). The major groups ranged from an estimated annual average of $78,506 for management occupations to $20,520 for food preparation & serving-related occupations.
The Casper MSA and Northeast and Southwest regions each had an estimated average annual wage for all occupations that was higher than the statewide average (see Tables 2-7).
Although the estimated average  annual wage in healthcare practitioners & technical occupations major group ($67,450) was second highest of all major groups statewide, all of the top 10 highest paying occupations were from that group (see Table 8). The occupation that had the highest average annual wage was surgeons, at an estimated $230,265 per year.
The average annual wage for all occupations  in the Casper MSA was $41,114, or 101.8% of the statewide annual average for all occupations ($40,381; see Table 9). The average for the Cheyenne MSA, at $39,616, was 98.3% of the statewide average. The Northeast and Southwest regions had averages that were higher than the statewide average, while the Central-Southeast and Northwest regions were lower than the statewide average. The highest average was in the Southwest Region (105.7% of the statewide average, or $42,634), while the lowest average was in the Northwest Region (91.2% of the statewide average, or $36,750).
In the Casper and Cheyenne MSAs, as well as all four regions, occupations from 2 of the 22 major groups – management occupations and healthcare practitioners & technical occupations – made up the majority of top 10 highest paying occupations (see Tables 10-15). All four regions and both MSAs had average annual wages below the national mean of $43,460.
For more information, contact Deana Hauf, OES program economist (dhauf@state.wy.us), or Phil Ellsworth, information specialist (pellsw@state.wy.us).
Bureau of Labor Statistics, U.S. Department of Labor, Occupational Employment Statistics. (2010, June). Occupational Employment Statistics (OES) highlights: An Overview of U.S. Occupational Employment and Wages in 2009. Retrieved June 22, 2010, from http://www.bls.gov/oes/highlight_2009.pdf