The Survey of Occupational Injuries and Illnesses for 2007
Definitions
Case of job transfer: An injured or ill employee was assigned to a job other than his or her regular job for part of the day other than the day of injury or illness.
Case of restricted duty: An employee was kept from performing one or more routine functions (work activities the employee performed at least once per week) of his or her job, or was kept from working a full workday, or a licensed health care professional recommended either of the above.
Cases, other recordable: Cases not involving days away from work or days of job transfer or restricted duty but requiring medical treatment beyond first aid. Other recordable cases include, for example, loss of consciousness, medical removal from job site, musculoskeletal disorders, or other significant diagnosed injury or illness.
Cases with days away from work: Severe cases that counted the day after the injury or onset of the illness, which may or may not include days of job transfer or restriction.
Event or exposure: The manner in which the injury or illness was produced or inflicted, such as falls, overexertion, or repetitive motion.
Incidence rate: Represents the number of injuries and illnesses per 100 full-time workers, calculated as (N/EH) x 200,000 where:
- N = number of injuries and illnesses
- EH = total hours worked by all employees during the calendar year
- 200,000 = base for 100 equivalent full-time workers (working 40 hours per week, 50 weeks per year)
Nature of injury or illness: The physical characteristic of the disabling injury or illness, such as cuts, fractures, or sprains.
Out of scope: An employer who did not have employees for the survey year or an employer whose employment size class or industry code changed.
Part of body: The part of the body directly linked to the nature of injury or illness cited, such as back, finger, or eye.
Relative standard error (RSE): A percentage of the estimate. The standard error defines a range (confidence interval) around the estimate. The approximate 95% confidence interval is the estimate plus or minus twice the standard error.
Source of injury or illness: The object, substance, exposure, or bodily motion that directly caused the disabling condition, such as chemical, vehicle, or machinery.
This article summarizes the 2007 Wyoming Survey of Occupational Injuries and Illnesses cases and compares them to previous years. The data include estimates of incidence rates and the nature, part of body, source, and event or exposure that caused the injury or illness. Also included are worker demographics and other characteristics of the occurrence (i.e., day of the week).
Research & Planning (R&P) conducts the annual Survey of Occupational Injuries and Illnesses for Wyoming in cooperation with the U.S. Bureau of Labor Statistics (BLS). The survey data identify the estimated incidence rates of injuries and illnesses at the industry level. Detailed characteristics of severe injuries and illnesses (those that result in days away from work) also are identified by the survey. This information can be used by employers and safety awareness groups to focus on prevention. The data are also used by regulatory agencies for tracking injury and illness trends to target safety resources. All italicized words or phrases are explained in the “Definitions” box at right.
Background and Methodology
For this survey, approximately 2,700 Wyoming private industry employers were notified in December 2006 to keep records of their firms’ work-related injuries and illnesses during 2007. In January 2008, these same employers were sent a 12-page survey booklet to transfer the data from the OSHA 300 forms sent in 2006. Occupational injury and illness data for approximately 200 employers were added by two federal entities, the Mine Safety and Health Administration and the Federal Railroad Administration of the U.S. Department of Transportation. Approximately 14% of the employers in the original sample either went out of business or were determined to be out of scope. Of the remaining employers in the sample, 95% responded to the survey.
Data were reported on the basis of unique incidents and employees. If an employee experienced more than one work-related injury or illness during the year, each incident was reported separately. If an event injured more than one employee, each employee was reported on the survey.
BLS estimates incidence rates from the gathered data. Incidence rates by industry indicate the number of illnesses or injuries per 100 employees. National rates are also determined from standard surveys conducted throughout the country. Through the states’ efforts, BLS gathers employer data including the number of days away from work an employee took for a work-related accident or illness. Cases with employees who are not out of work beyond the day of injury are not counted as incidents with days away from work, but these may be included in total recordable cases. BLS counts up to 180 days away from work per case. Another data element is the other recordable case, which indicates an injury or illness not requiring days away from work, days of job transfer, or restricted duty, but requiring medical treatment beyond first aid.
Incidence Rates
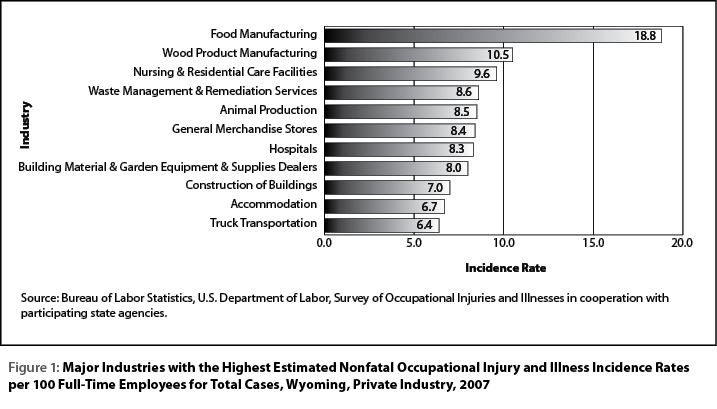
In 2007 the overall private ownership estimated incidence
rate in Wyoming was 4.6 injuries and illnesses per 100 full-time employees.
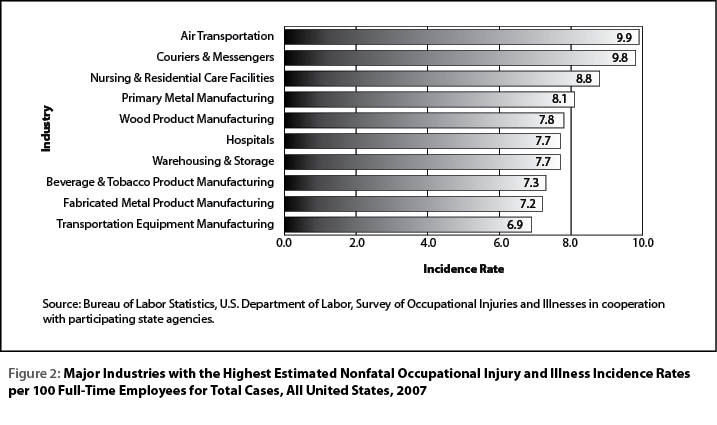
Three of the 10 subsectors with the highest estimated incidence rates nationally
were also found in Wyoming’s top 10 (see Figure
1 and Figure 2). The
relative standard error published by BLS was used to calculate the estimates,
with a 95% confidence interval.
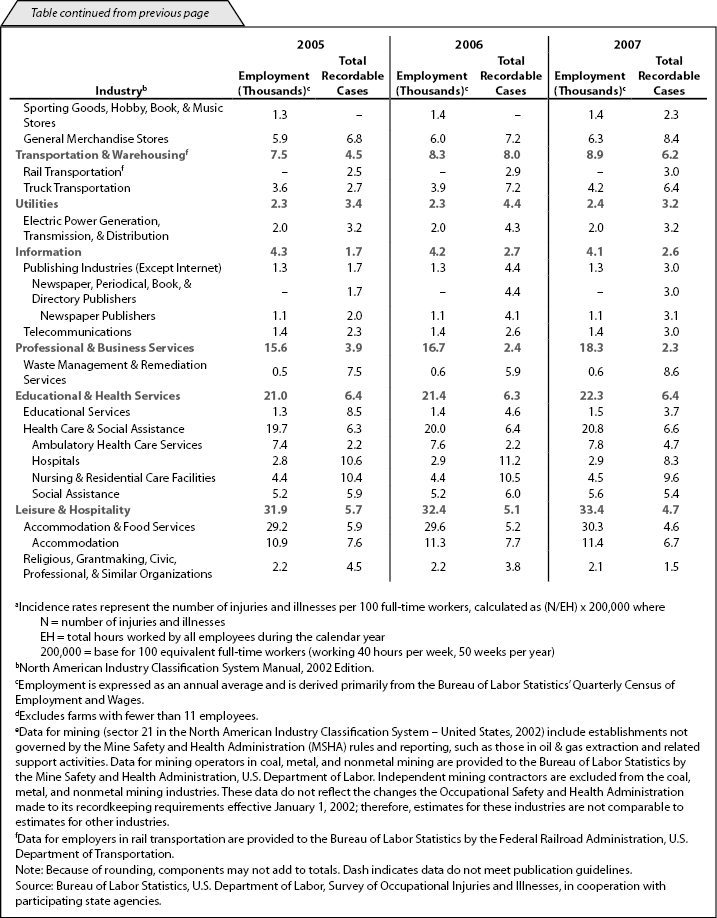
As indicated in Tables 1 and 1a,
Wyoming employment in 2007 increased in a majority of industries, and the
estimated incidence rates decreased. When comparing past survey results,
employment in mining increased from 22,000 in 2005 to 27,300 in 2007, but
the incidence rate decreased from 4.9 to 3.0. The incidence rate for transportation & warehousing
was 6.2 in 2007, a decrease from the 2006 rate of 8.0 but higher than the
2005 rate of 4.5. From 2006 to 2007, food manufacturing, an industry subsector
with one of the highest incidence rates, had a significant increase from
11.1 to 18.8.
The number of serious injury or illness cases has remained at 3,800 or below for the past five years, while the overall incidence rate has ranged from 4.6 to 6.0.
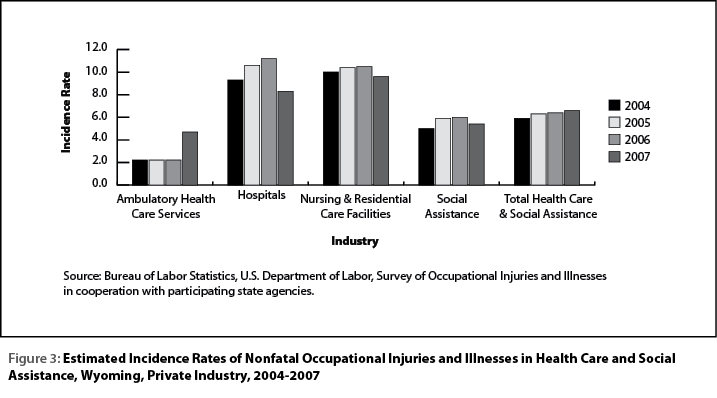
Health care & social assistance experienced increasing incidence rates from 2003 to 2007 (see Figure 3). However, at the industry subsector level, three of four subsectors had incidence rates that decreased in 2007. Over the reference period, as employment remained the same or increased in hospitals and nursing & residential care facilities, the incidence rate decreased. This may suggest a relationship between higher staffing levels and lower incidence rates in those subsectors.
Case and Demographic Data
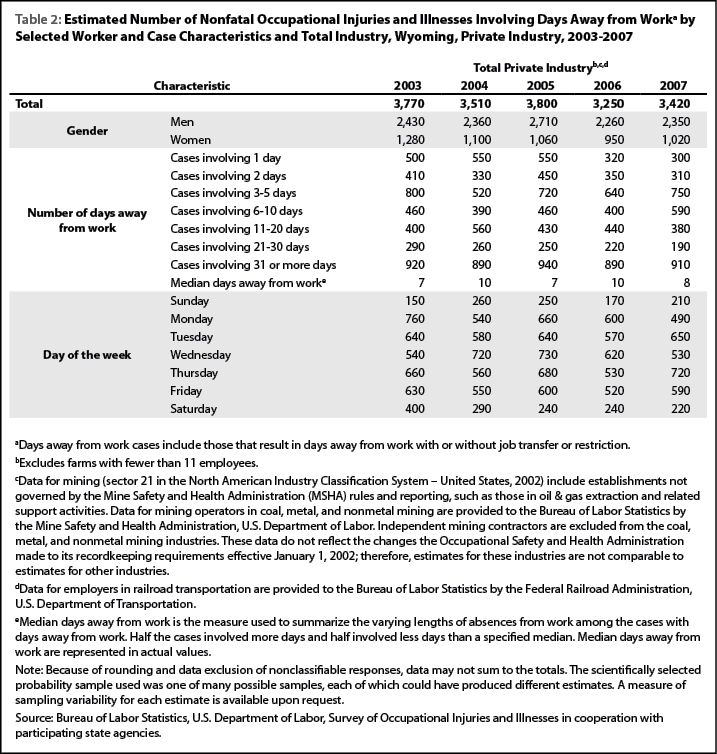
Table 2 shows the number of nonfatal occupational injuries and illnesses by selected characteristics for Wyoming from 2003 to 2007. An estimated 3,420 occupational injuries and illnesses (only those with days away from work, not including injuries or illnesses that resulted solely in job transfers or restricted duties or those that were other recordable cases) occurred in private industry in 2007, a 5.2% increase from 3,250 in 2006. Other data from this survey revealed that work-related injuries and illnesses occurred most often on Thursdays, whereas for the previous several years they usually occurred on Wednesdays. In the last five years, most cases resulted in 31 or more days away from work.
Worker Characteristics
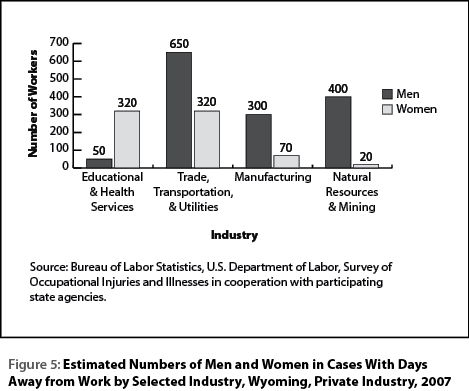
In 2007, men comprised 55.6% of Wyoming’s workforce (BLS, 2008). Of the total work-related injuries and illnesses in 2007, 68.7% involved men. This contrasts with the Census of Fatal Occupational Injuries and Illnesses (CFOI) data showing that 89.6% of Wyoming fatalities in 2007 were men (CFOI, 2008). Far more men than women worked in occupations typically associated with higher-than-average injury and illness rates, such as construction & extraction (see Figure 4). This occupational group includes all other construction laborers and extraction workers, who most often work in the natural resources & mining industry (400 men and 20 women were injured or became ill on the job; see Figure 5). Trade, transportation, & utilities had twice the number of men (650) than women (320) who suffered cases with days away from work. These workers included salespersons, truck drivers, and laborers. The percentage of Wyoming workers who were women was 44.8% in 2007 (BLS, 2008), but only 29.8% of workers who became injured or ill in 2007 were women. However, more women than men were injured in service occupations such as nursing aides and maids & housekeeping cleaners. More women than men were also hurt or became ill in educational & health services (320 and 50, respectively).
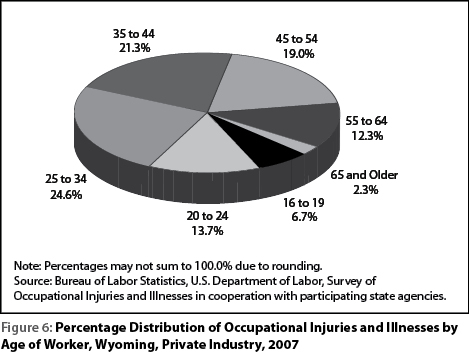
The highest percentage of injuries and illnesses by age group in 2007 was for workers age 25 to 34 (24.6%; see Figure 6). In contrast, the age groups with the most injuries and illnesses in 2006 were 35 to 44 and 45 to 54 (23.0% each). Since 2002, the survey has shown that the incidence rate for individuals age 35 to 44 and 45 to 54 has increased.
Injury and Illness Characteristics
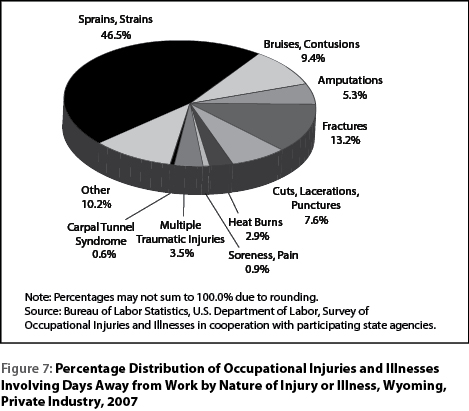
For injuries resulting in days away from work, the largest percentage for nature of injury or illness was due to sprains and strains (46.5% in 2007; see Figure 7). Often the injuries were caused by falling, lifting, twisting and bending, standing or sitting, throwing, or reaching. In fact, sprains and strains were the leading cause of injuries resulting in days away from work from 2002 through 2007. This suggests that employers should place additional emphasis on sprain and strain prevention.
Occupation
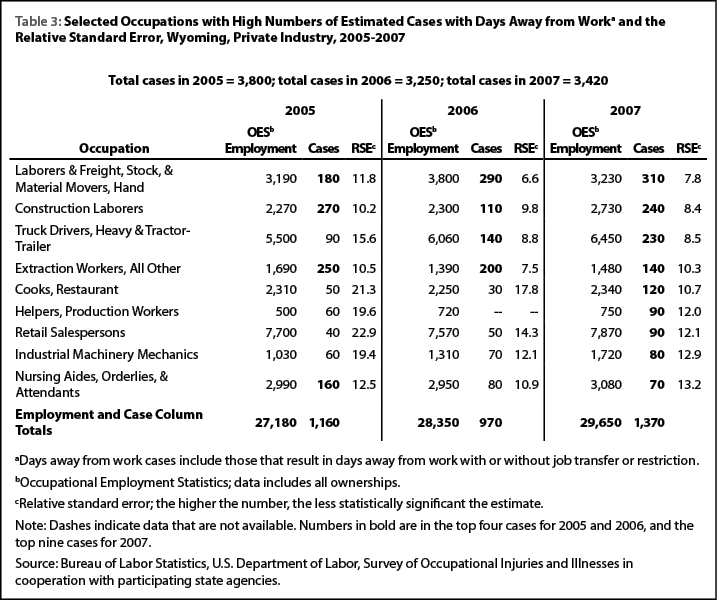
Table 3 shows four of nine occupations that had high numbers of cases in 2005 through 2007. In 2007, hand laborers & freight, stock, & material movers had the most injuries and illnesses resulting in days away from work (310). This occupation also had the highest number of cases in 2006 (290). In contrast, in 2005 construction laborers recorded the most (270 cases).
The second highest number of cases by occupation in 2007 was for construction laborers (240), whereas all other extraction workers had 200 cases in 2006 and 250 in 2005. Increases occurred in several occupations, including construction laborers (110 to 240) and heavy & tractor-trailer truck drivers (140 to 230).
Much of the annual variation in the number of work-related injuries and illnesses could be related to the nature of Wyoming’s jobs. Another factor could be an increase or decrease in employment for certain occupations. In 2006, there were an estimated 3,800 hand laborers & freight, stock, & material movers in Wyoming (Wyoming Occupational Employment and Wages, 2007). In 2007, that number decreased to 3,230 workers (-15.0%; Wyoming Occupational Employment and Wages, 2008). More than 9.6% of those employees were injured in 2007; fewer than 7.6% were injured in 2006. The percentage of the injured or ill rose 26.3%. This suggests, at least for this occupation, that with fewer workers than in previous years, injuries occurred at a higher rate, possibly because the demand for workers outpaced the supply. Another reason may be the lower level of experience among new workers.
Summary
From 2006 to 2007, Wyoming experienced an increase of an estimated 170 work-related injuries and illnesses resulting in days away from work. Overall, men continued to experience work-related injuries and illnesses more frequently than women. This was likely due, in part, to higher ratios of men to women employed in industries with higher estimated incidence rates; the exception was educational & health services. In general, as in 2006, older workers in more dangerous professions who had less job experience incurred more work-related injuries and illnesses in 2007. More detail on 2007 data as well as historical data and documentation is available at http://doe.state.wy.us/LMI/OSH/OSH_07/toc.htm.
References
Bureau of Labor Statistics, Division of Local Area Unemployment Statistics. (2008, March). Employment status of the civilian noninstitutional population by sex, race, Hispanic or Latino ethnicity, and detailed age, 2007 annual averages. (preliminary). Retrieved December 29, 2008, from http://www.bls.gov/lau/ptable14full2007.pdf
Census of Fatal Occupational Injuries and Illnesses, Wyoming. (2008). Retrieved October 20, 2008, from http://doe.state.wy.us/LMI/CFOI/CFOI_07/t7.htm
Wyoming Occupational Employment and Wages. (2007, December). Retrieved October 23, 2008, from http://doe.state.wy.us/LMI/200604EDS/TOC000.HTM
Wyoming Occupational Employment and Wages. (2008, September). Retrieved October 23, 2008, from http://doe.state.wy.us/LMI/EDSPub20083ECI/TOC000.HTM