© Copyright 2007 by the Wyoming Department of Employment, Research & Planning
Vol. 44 No. 1
This article presents detailed characteristics of Wyoming cases reported in the Survey of Occupational Injuries and Illnesses for 2005. In addition, demographic details are provided for those workers who had days away from work. These data include the nature, part of body, source, and event or exposure of the injury or illness as well as the sex, race, age, time of day, and length of service of the injured or ill workers.
Research & Planning (R&P) annually conducts the Survey of Occupational Injuries and Illnesses in cooperation with the U.S. Bureau of Labor Statistics (BLS). The survey data identify industries with the highest incidence rates of injuries and illnesses. Characteristics of more severe injuries and illnesses (those that result in days away from work) also are identified by the survey. Previous articles about the survey focused on summary data (e.g., Cowan, 2006). This article addresses case and demographics data, which describe injuries that resulted in days away from work. These data were released four and a half months earlier than in 2003, permitting their use by agencies such as the Occupational Safety and Health Administration (OSHA) earlier than in previous years. These data include: nature of injury or illness; part of body injured; source of injury; event or exposure of the injury; and other characteristics.
Methodology
For this survey, 2,213 Wyoming employers were notified to keep records of their firms’ work-related injuries and illnesses for 2005. The data were then reported to R&P in 2006. This mandatory survey had a response rate of 97%, which is less than a 2% difference from the previous year’s results. The lower response rate may be due to BLS shortening the data collection period by one month.
Data were reported on the basis of unique incidents and employees. If an employee had more than one work-related injury or illness during the year, each incident was reported separately. If a catastrophic event that injured more than one employee occurred, each employee was reported on the survey.
The survey has been conducted annually by R&P since 2002. However, comparisons can only be made for the last three years because of methodology changes. Data for 2002 used the Standard Industrial Classification (SIC) system. Beginning in 2003, BLS adopted the North American Industry Classification System (NAICS). The occupational coding system changed in 2003 as well, from the Occupational Injury and Illness Occupational Coding Manual to the Standard Occupational Classification (SOC) system. Consequently, industry and occupational data collected prior to 2003 are not comparable to the more recent data. Much of the case and demographics data, however, can be compared across all years.
The Relative Standard Error published by the BLS was used, with a 95% confidence interval. Weights were also added to each sampled firm to help account for firms that went out of business, increased or decreased in employment size, or changed industry codes after being selected for inclusion in the sample. For further discussion on the survey methodology, refer to Davis (2005).
Incidence Rates
In 2005 the overall private industry incidence rate in Wyoming was 5.8 injuries and illnesses per 100 full-time employees. As can be seen in Figure 1, 5 of the 10 industries with the highest incidence rates nationally were also found in Wyoming’s top 10.
Only one industry in Wyoming, rental and leasing services, experienced a significant change from 2004 to 2005. In 2004 the incidence rate was 1.9; in 2005, it was 8.7. This could be due to an increase in employment or hours worked in the industry or a decrease in the percentage of long-term, experienced employees.
Case and Demographic Data
Table 1 and Figure 2 show the number of nonfatal occupational injuries and illnesses by selected characteristics for Wyoming (2003 – 2005). There were an estimated 3,800 occupational injuries and illnesses (only those with days away from work, not including injuries or illnesses which resulted in restricted duty or those that were just recordable) that occurred in private industry in 2005, compared to 3,510 in 2004. The median days away from work was 7 in 2005 and 10 in 2004. One possible explanation is the 2004 injuries may have been more severe than those which occurred in 2005.
Worker Characteristics
While men made up 50% of the population in Wyoming as of July 2005 (Wyoming Economic Analysis Division, 2006), 71.3% of the work-related injuries and illnesses in 2005 involved men. A possible explanation for the gender difference is the fact that more men than women worked in many of the industries typically associated with higher-than-average injury and illness rates (see Figure 3), such as Natural Resources & Mining and Construction. However, women were injured significantly more than men in Health Care and Social Assistance: 390 women compared to 50 men in 2004, and 330 women to 50 men in 2005. The other industry in which women outnumbered men for injuries and illnesses is Accommodation: 140 women to 100 men in 2004. The 25- to 34-year-old group had the most injuries and illnesses in 2005 (910, 23.9%); in 2004, workers 35 to 44 had the most (800, 22.8%).
In 2004 and 2005, workers who were employed less than 3 months were exposed to work-related injuries and illnesses more frequently than their peers with more tenure. These workers accounted for 1,030 and 950 injuries and illnesses in 2005 and 2004, respectively. In 2003, the most injuries and illnesses were incurred by workers with 1 to 5 years of service (1,180 injuries and illnesses).
Injury and Illness Characteristics
In cases with days away from work, sprains and strains were most often reported (49.5% in 2005). The injuries were often caused by falling down, lifting, twisting or bending, standing or sitting, throwing, or reaching. The high frequency with which sprains and strains occur suggests that employers should place more emphasis on strain and sprain prevention.
The trunk was most often reported as the injured part of the body (41.3%); back injuries, which are included in trunk injuries, accounted for 21.8% of reports.
Floors, walkways, and ground surfaces accounted for 20.5% of all sources of injury or illness, followed by parts and materials (16.6%). In the cases involving floors, walkways, and ground surfaces, the most likely event would be a fall at the same level (13.1%) or bodily motion such as a trip or slip without a fall (1.6%).
Events or exposures: Contact with objects and equipment came in as the most common event or exposure at 27.4%. For example, an object such as a piece of construction equipment with a swing arm could strike a worker and cause a sprained back. Overexertion, the second leading event or exposure (26.1%), as in lifting or throwing a part or material, could also sprain the trunk.
Occupation
Table 2 shows 10 occupations each for 2004 and 2005 that experienced the most injuries and illnesses. Seven of the 10 occupations are listed in both years. In 2005, construction laborers (270) had the most injuries and illnesses resulting in days away from work. In contrast, truck drivers, heavy and tractor-trailer recorded the most (210) in 2004. Increases occurred in several occupations, including electricians (70 to 100) and laborers, freight, stock, and material movers, hand (140 to 180).
What would cause some occupations to have more (or less) work-related injuries and illnesses? Much of the difference could be related to the nature of the jobs that compose Wyoming’s workforce and an increase or decrease in employment in certain industries. According to Occupational Employment Statistics (2006), there were an estimated 2,660 construction laborers in the state in 2004, and 2,270 in 2005. More than 10% of those employees were injured in 2004; less than 10% were injured in 2005. The percentage changed little, but employment decreased. This suggests laborers were working more hours or doing the work of more than one employee, thus creating the same hazardous situations with fewer people.
Summary
Wyoming experienced an estimated increase of 290 work-related injuries and illnesses resulting in days away from work from 2004 to 2005. Overall, men continued to experience work-related injuries and illnesses more frequently than women. This is likely due, in part, to higher levels of employment for men than women in certain industries with higher incidence rates for injuries and illness; health care industries are the exception. In general, occupations tend to have fairly similar levels of injuries and illnesses over time.
References
Cowan, C. (2006). How safe are Wyoming industries? Comparisons to national averages. Wyoming Labor Force Trends 43(7). Retrieved October 17, 2006, from http://doe.state.wy.us/LMI/0706/a1.htm
Davis, V. (2005). The survey of occupational injuries and illnesses for 2003. Wyoming Labor Force Trends 42(2). Retrieved June 19, 2006, from http://doe.state.wy.us/LMI/0205/a1.htm
Occupational Employment & Wages/Statewide, County and Regional Wages, 2005. Retrieved November 18, 2006, from http://doe.state.wy.us/LMI/200504EDS/TOC000.htm
Wyoming Economic Analysis Division. (2006). Annual estimates of the population by sex, race and Hispanic or Latino origin in Wyoming: April 1, 2000 to July 1, 2005. Retrieved November 29, 2006, from http://eadiv.state.wy.us/pop/ST_RO05.htm
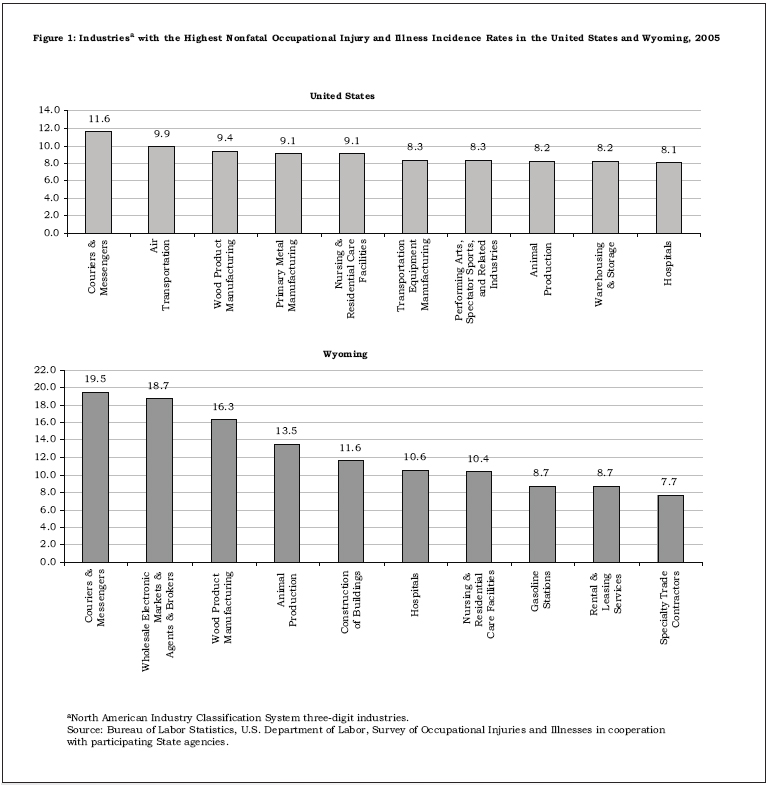
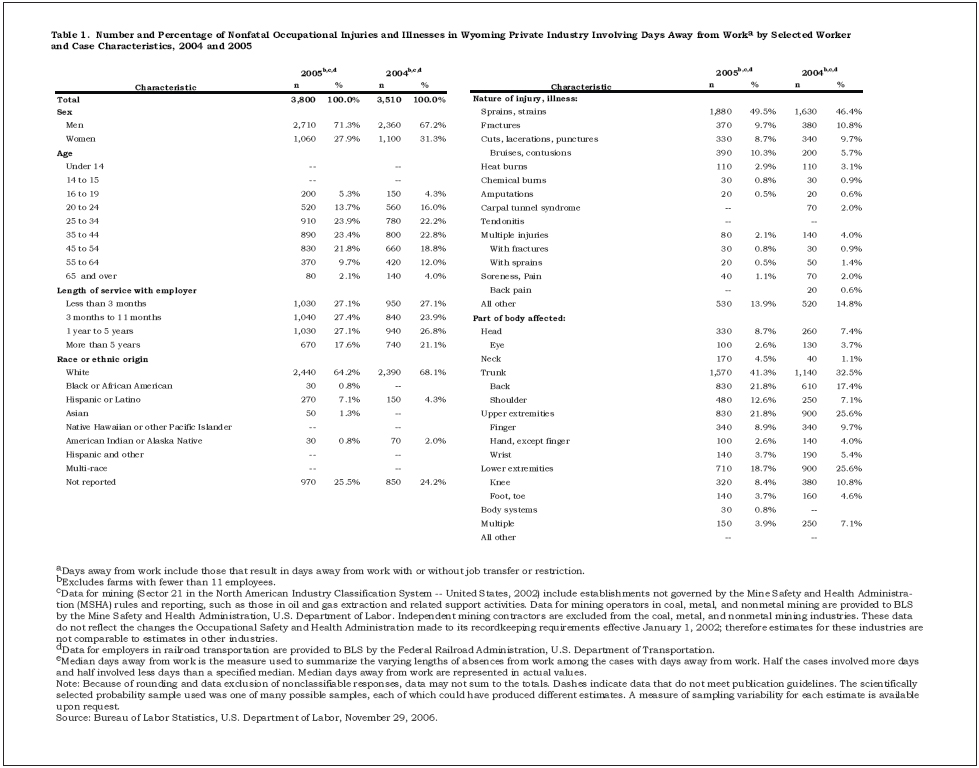
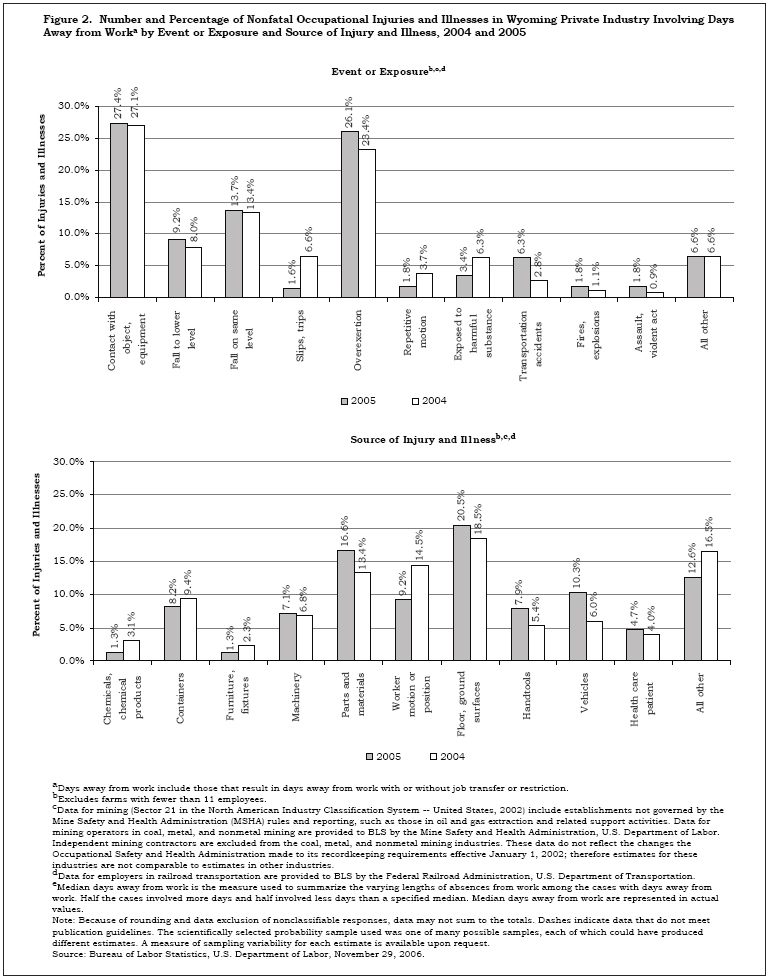
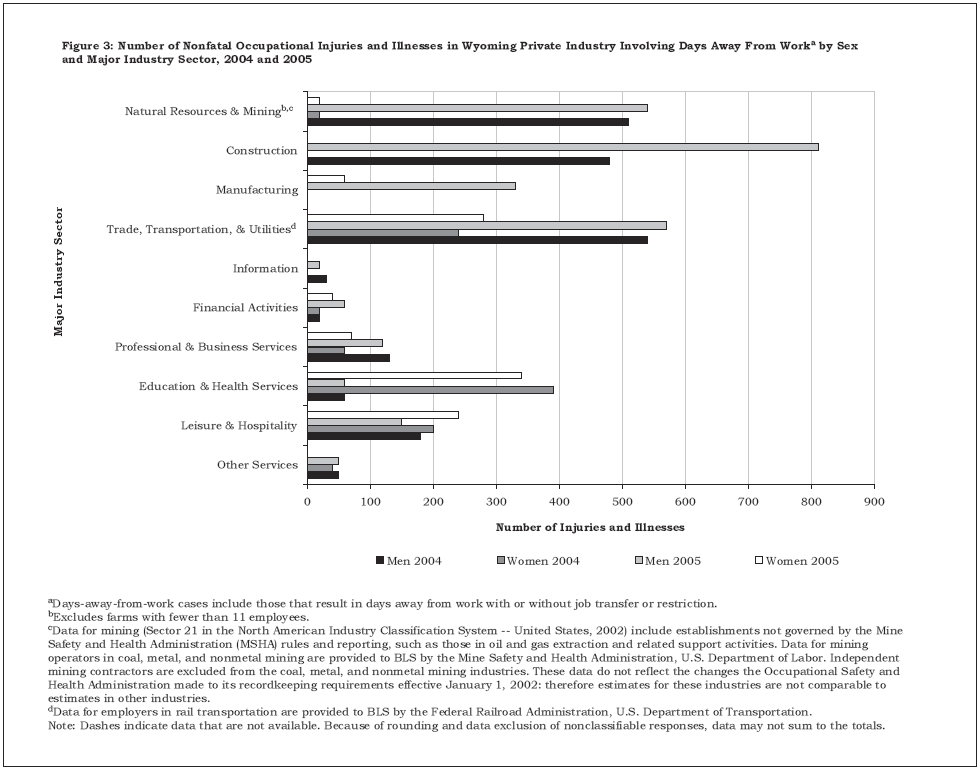
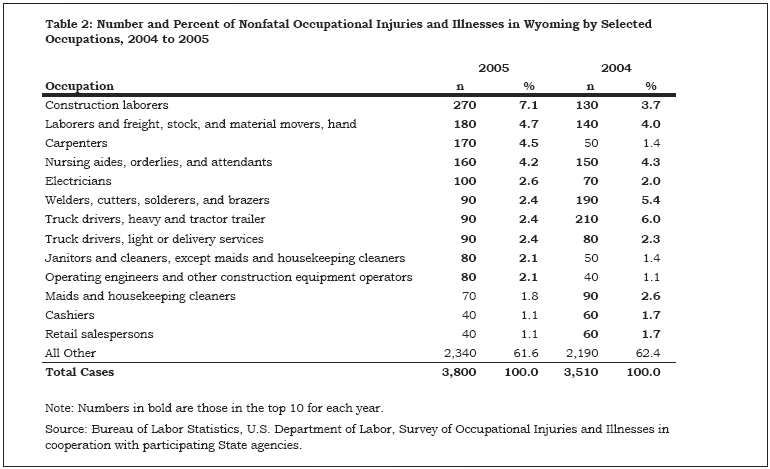
Table of Contents | Labor Market Information | Wyoming
Job Network | Send Us Mail
Last modified on
by Phil Ellsworth.