© Copyright 2006 by the Wyoming Department of Employment, Research & Planning
Vol. 43 No. 7
The data in the annual Survey of Occupational Injuries and Illnesses, collected by Research & Planning in cooperation with the U.S. Bureau of Labor Statistics, identify sectors with the highest incidence rates of injuries and illnesses. This state data can then be compared to national data to determine whether specific industries in the state have higher or lower incidence rates of injuries and illnesses than the national average for those industries.
Research & Planning (R&P) conducts the annual Survey of Occupational Injuries and Illnesses in cooperation with the U.S. Bureau of Labor Statistics (BLS). The survey data identify sectors with the highest incidence rates of injuries and illnesses. This information can be used by safety awareness groups to focus safety training in these areas. This article presents incidence rates of nonfatal occupational injuries and illnesses in Wyoming for 2004 per 100 full-time workers and compares them to the previous year and to the U.S.
Background and Methodology
Approximately 2,500 Wyoming employers were asked to keep records of their work-related injuries and illnesses for 2004 and report the data to R&P in 2005. This mandatory survey had a response rate of 98%. If an employee had more than one work-related injury or illness during the year, each incident was reported separately. If a catastrophic event that injured more than one employee occurred, each employee would be reported on the survey. Although three years of Wyoming Data were available we could only compare the last two years because of methodology changes. The survey results for 2003 and 2004 were based on the North American Industry Classification System (NAICS) codes assigned to employers when they registered with the Department of Employment for unemployment insurance. Prior results were based on the Standard Industrial Classification (SIC) codes no longer in use. The occupational coding system also changed in 2003 from the Occupational Injury and Illness Occupational Coding Manual to the Standard Occupational Classification (SOC) system. These changes represent a time-series break in the data which prevented comparisons between 2002 and 2003.
We used the Relative Standard Error (RSE) published by the Bureau of Labor Statistics and a 95% confidence interval to test for statistical significance. For details on the survey methodology refer to the article “The Survey of Occupational Injuries and Illnesses for 2003” in the February 2005 issue of Wyoming Labor Force Trends (Davis).
Results and Discussion
The overall incidence rate for Wyoming in 2004 was 5.3 per 100 full-time employees. This translates into an estimated 14,500 work-related injuries or illnesses.
The 10 subsectors with the highest incidence rates for Wyoming are displayed in Figure 1. In comparison, the 10 subsectors with the highest incidence rates for the U.S. are shown in Figure 2. Wyoming’s mix of industries with the highest rates of injuries and illnesses is quite different than that of the U.S. Only three subsectors are represented in both the U.S. and Wyoming: wood product manufacturing, nursing & residential care facilities, and hospitals. Four of the 10 highest subsectors in the U.S. were in Manufacturing, whereas Wyoming had only one subsector in Manufacturing. This result is not surprising given the underrepresentation of Manufacturing in Wyoming (Harris, 2002). Another of the three highest subsectors for the U.S. was in Transportation. The Transportation sector was not represented in Wyoming’s 10 highest. Wyoming did, however, have two subsectors in Construction and two in Retail Trade among its 10 highest, whereas the U.S. did not have any of its highest in those two sectors.
A closer look at Wyoming’s subsectors with the highest incidence rates shows that wood product manufacturing had an incidence rate of 17.2 in 2004 compared to 17.1 in 2003 (see Table), which is not a statistically significant increase. In contrast, furniture & home furnishings stores had a significant increase from 5.3 in 2003 to 11.0 in 2004. General merchandise stores, as well as merchant wholesalers, durable goods also had changes in incidence rates compared to the previous year, though neither was statistically significant. Building construction also showed a significant change with a decreasing incidence rate from 14.3 to 7.6. No significant change from the previous year was found for specialty trade contractors (7.4 to 7.0). Data for administrative & support services were not available for 2003. Therefore a comparison could not be made to the incidence rate of 7.7 in 2004.
Accommodation had a relatively high incidence rate per 100 full-time workers in Wyoming and the U.S. at 8.6 and 5.8, respectively. Wyoming’s 2004 incidence rate in accommodation was down from 12.1 in 2003, though the drop was not statistically significant. Hospitals showed an incidence rate of 8.3 for the U.S. compared to 9.3 for Wyoming, a significant drop from 12.3 the previous year. Incidence rates in nursing & residential care facilities in Wyoming (10.0) and the U.S. (9.7) were not significantly different. The slight drop in Wyoming’s incidence rate from 11.8 in 2003 also was not statistically significant.
Comparisons to other subsectors with high incidence rates in the U.S. could not be made because Wyoming data were not available for those industries in 2004. One subsector, animal production, had data in 2003. The incidence rate was 18.4 in 2003 and significantly larger than the 8.2 the U.S. showed that year.
Mining was not represented in subsectors with the highest incidence rates for either the U.S. or Wyoming, but due to the importance of Mining in Wyoming it was included in the analysis. The difference between Wyoming and the U.S. was not statistically significant for Mining as a whole (4.2 for Wyoming compared to 3.8 for the U.S.); oil & gas extraction (4.4 compared to 2.6); and support activities for mining (4.7 compared to 3.8). On the other hand, in Mining (except oil & gas), Wyoming had a significantly smaller incidence rate (3.3) than the U.S. (4.3). The difference in incidence rates is partially due to the fact that all but one of Wyoming’s coal mines are surface mines, which typically have fewer days lost to injuries (Mine Safety and Health Administration [MSHA], 2006a) and fewer fatalities (MSHA, 2006b) than do underground mines.
Future Research
R&P is linking the Occupational Injuries and Illnesses Survey data with data from Workers’ Compensation. This link will enable us to estimate the costs of occupational injuries and illnesses, as well as identify possible underreporting of injuries in the survey.
Conclusion
The results of the survey show that the industries with the highest incidence rates in Wyoming are different from the U.S. largely due to our unique mix of industries. We also observed that some industries have significantly different incidence rates than they had in the previous year. Overall, safety records improved over the last year.
References
Davis, V. (2005). The Survey of Occupational Injuries and Illnesses for 2003. Wyoming Labor Force Trends 42(2). Retrieved June 19, 2006, from http://doe.state.wy.us/LMI/0205/a1.htm
Harris, M. (2002). Is Wyoming’s economy diversifying and is economic diversity in Wyoming desirable? Wyoming Labor Force Trends 39(9). Retrieved July 19, 2006, from http://doe.state.wy.us/LMI/0902/toc.htm
Mine Safety and Health Administration. (2006, August 9). Mine Injury and Worktime Quarterly Statistics. Retrieved August 21, 2006, from http://www.msha.gov/ACCINJ/ALLCOAL.HTM
Mine Safety and Health Administration. (2006, July 31). Fatal Alert Bulletins, Fatalgrams and Fatal Investigation Reports. Retrieved August 21, 2006, from http://www.msha.gov/fatals/fab.htm
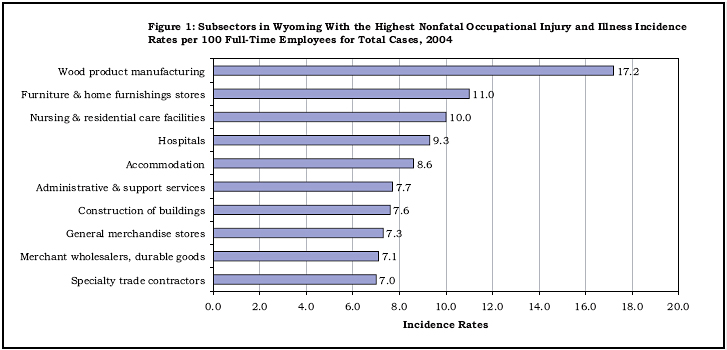
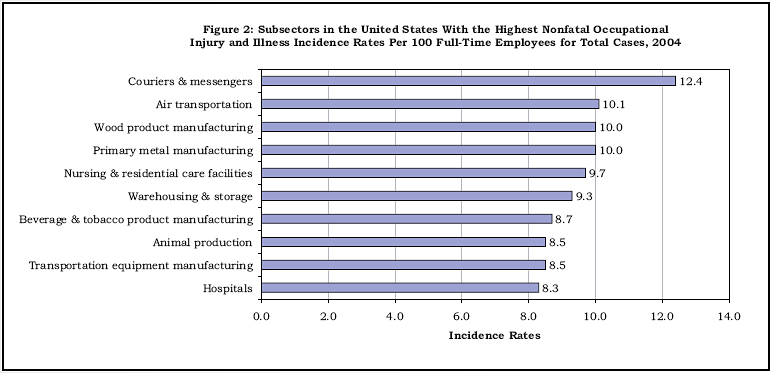
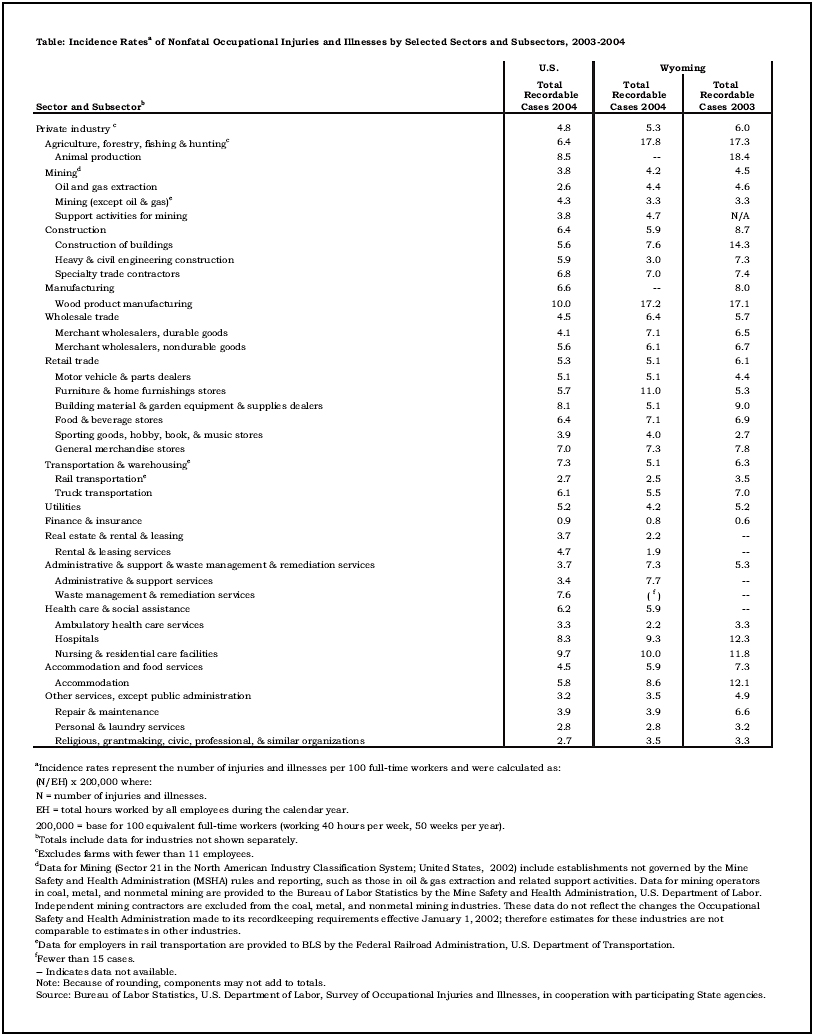
Table of Contents | Labor Market Information | Wyoming
Job Network | Send Us Mail
Last modified on
by Phil Ellsworth.