
WE Connect: Employment, Earnings, and Postsecondary Enrollment of Wyoming High School Students
Part 2: Opportunity Cost of Pursuing a Postsecondary Education in Wyoming
This article is an introduction to the opportunity cost facing Wyoming high school students who choose to enroll in a Wyoming postsecondary school, and specifically examines students enrolled in the 2013-14 school year1. Opportunity cost in this situation refers to the amount of money an individual could have earned if he or she had not enrolled in college. For this publication, it is calculated as the statewide average earnings minus the average earnings while in college (see Box).

Past research indicates between 64.1% (Dundes & Marx, 2006) and 77.8% (ACE Center for Policy Analysis, 2006) of college students work during their undergraduate years. Students may choose to work for a variety of reasons: to gain career experience, pay for college costs, or fulfill financial aid package obligations (Perna, 2010). However, a thorough review of the literature shows there is little, if any, research on the industries in which students work and their respective earnings. Research of this kind could help improve financial aid decisions, inform students of potential income, and possibly identify origins of the gender wage gap.
For this assessment of opportunity cost, only traditionally-aged2 undergraduate students who attended publich high school in Wyoming at some point during their secondary education and were enrolled full-time in a Wyoming college for both the fall 2013 and spring 2014 semesters are considered. Individuals meeting these criteria were divided into students of the University of Wyoming and students of any community college in the state. Students were then grouped by whether or not they worked at any point in the school year. Unless otherwise noted, the figures and tables describe only the workers in each population, and do not address individuals without wages during the periods including 2013Q3-2014Q2. The student groups are compared to Wyoming residents of the same age and employment status (generally referred to in this publication as statewide workers), regardless of postsecondary enrollment. A more detailed explanation of the data can be found in Chapter 4 of WDQI #1, here: https://doe.state.wy.us/LMI/education_we_connect/WDQI_Pub1.pdf.
Demographics
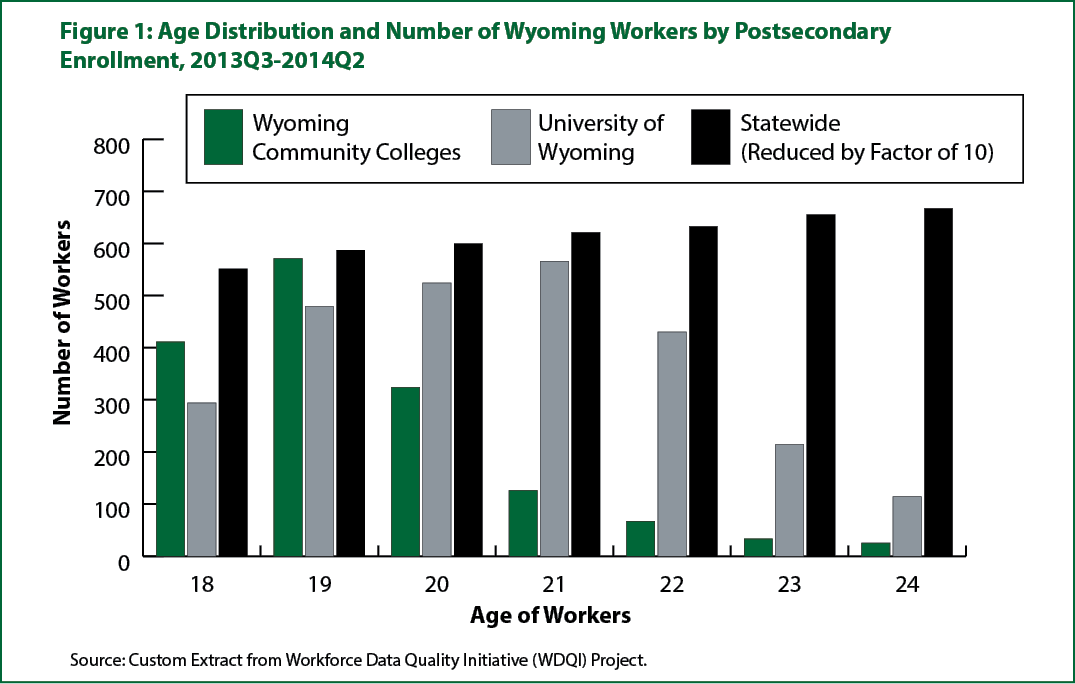
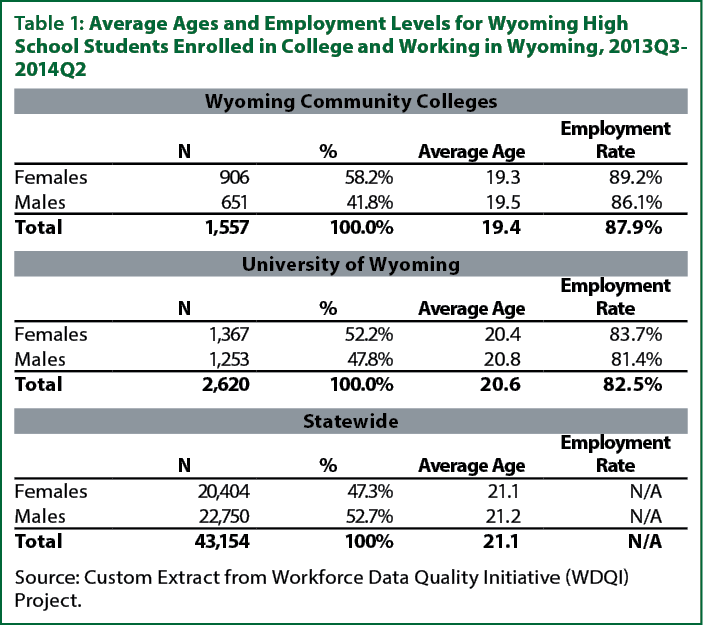
Table 1 lists the demographics of workers in each group. On average, working community college students in the 2013/14 school year were younger (19.4) than working University of Wyoming students (20.6), who were younger than all workers statewide for those ages 18-24 (21.1). The bar graph in Figure 1 shows the number of workers by age for community colleges, the University of Wyoming, and statewide.
Although the statewide employment to population ratio for this age group is not available, Wyoming community college students had a higher rate of employment during the school year than students at the University of Wyoming, 87.9% and 82.5%, respectively (see Table 1). One explanation for the college and University employment rates may be that students who wish to work may choose to attend a community college near their place of employment, rather than leave their job to attend the University.
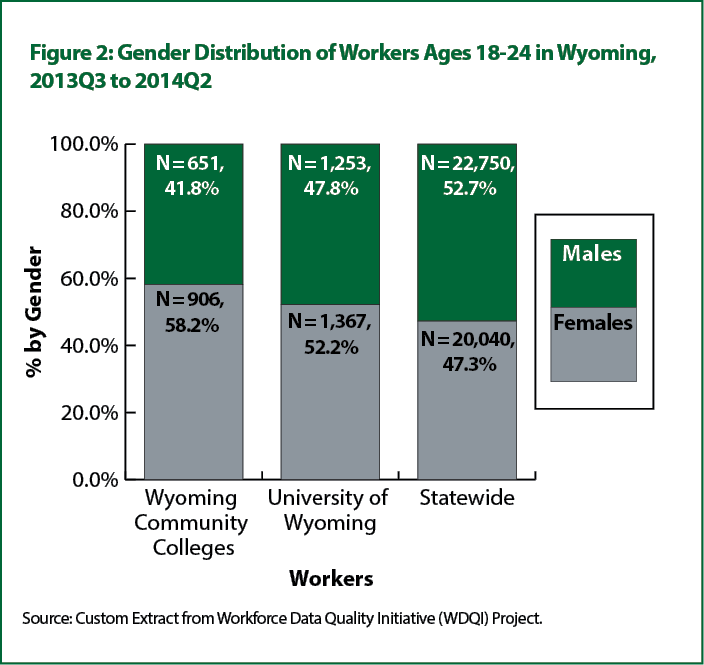
Females made up more than 50% of postsecondary student workers (see Figure 2), but only 47.3% of the statewide working population ages 18-24. A hypothesis explaining this trend may be that females drop out of school and the labor market to care for children (Harris, 2015). As shown in Table 1, females were also generally younger than their male counterparts, which may be a function of the age at which parents choose to enroll their children in elementary school, among other factors.
Earnings
Across all industries, student workers forgo higher earnings to obtain a postsecondary education. The median wage between 2013Q3 and 2014Q4 for working community college students is $6,917 (see Table 2), compared to $4,302 for University students, and $10,194 for statewide workers ages 18-24. In every industry except financial activities and mining, community college students earned higher wages on average than students attending the University of Wyoming. Females earned less than males; for each dollar earned by a male, females in community college made $0.85, females at the University of Wyoming made $0.89, and females statewide made $0.61.

Statewide, average earnings by primary industry,3 shown in Table 3, were greatest in mining ($46,199), wholesale trade, transportation, utilities, & warehousing ($29,067), manufacturing ($27,838), construction ($21,915), and financial activities ($21,211), but the highest percentage of individuals work primarily in leisure & hospitality (31.4%), retail trade (13.6%), and public administration (10.4%).
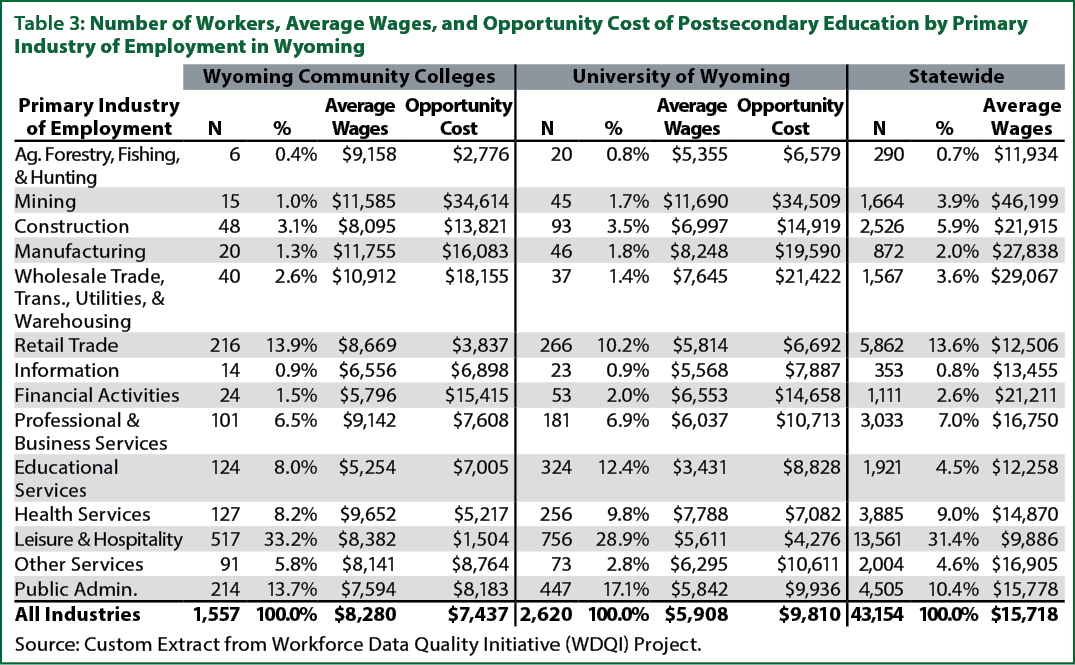
For community college students, the highest average wages during the school year were paid to students working primarily in manufacturing ($11,755), mining ($11,585), wholesale trade, transportation, utilities, & warehousing ($10,912), health services ($9,652), and agriculture, forestry, fishing, & hunting ($9,158). Leisure & hospitality, retail trade, and public administration had the greatest percentage of student workers, with 33.2%, 13.9%, and 13.7%, respectively. As shown in Table 3, working community college students had the greatest opportunity cost in mining; wholesale trade, transportation, utilities, & warehousing; manufacturing; financial activities; and construction, where the forgone earnings range from an average of $34,614 to $13,821. Figure 3 displays the opportunity cost for students, by primary industry, in a bar graph.
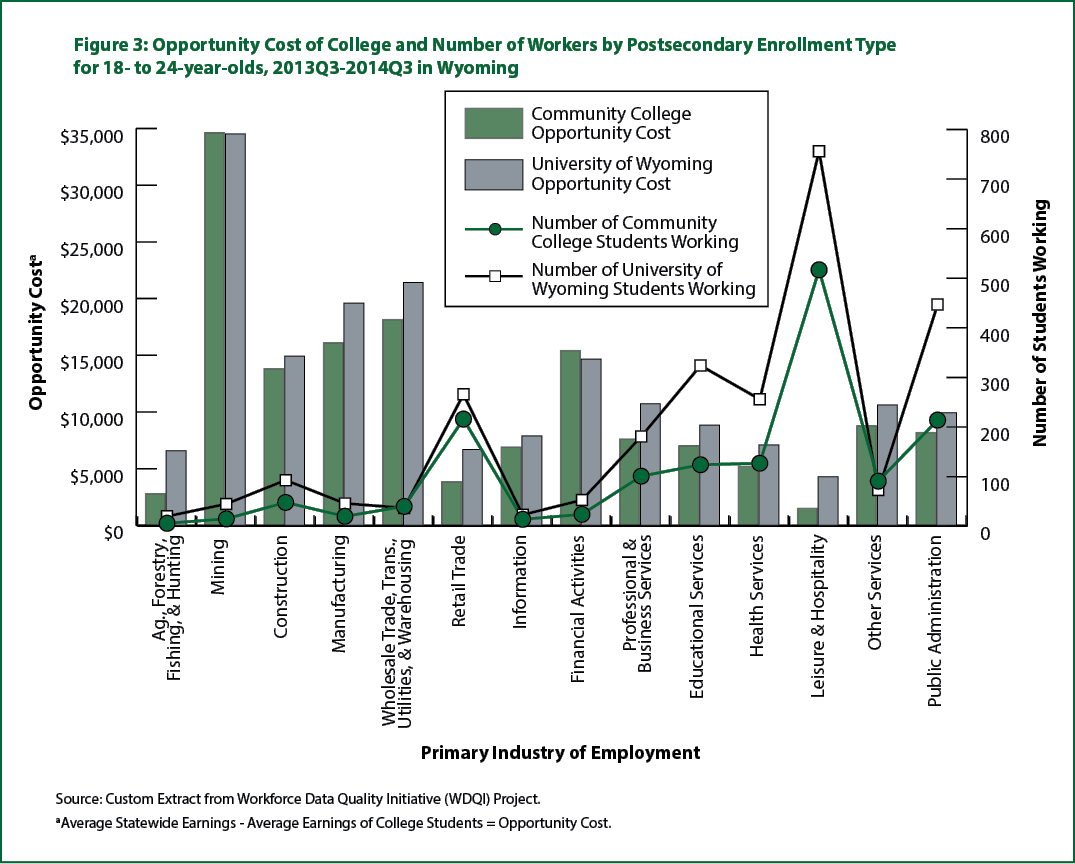
Table 3 also shows that student workers at the University of Wyoming earned the most in mining ($11,690), manufacturing ($8,248), health services ($7,788), wholesale trade, transportation, utilities, & warehousing ($7,645), and construction ($6,997). The greatest percentage of students worked in leisure & hospitality (28.9%), public administration (17.1%), and educational services (12.4%). As with students attending community college, students at the University also had the highest opportunity cost in mining ($34,509); wholesale trade, transportation, utilities, & warehousing ($21,422); manufacturing ($19,590); construction ($14,919); and financial activities ($14,658; see Figure 3).
Summary and Future Research
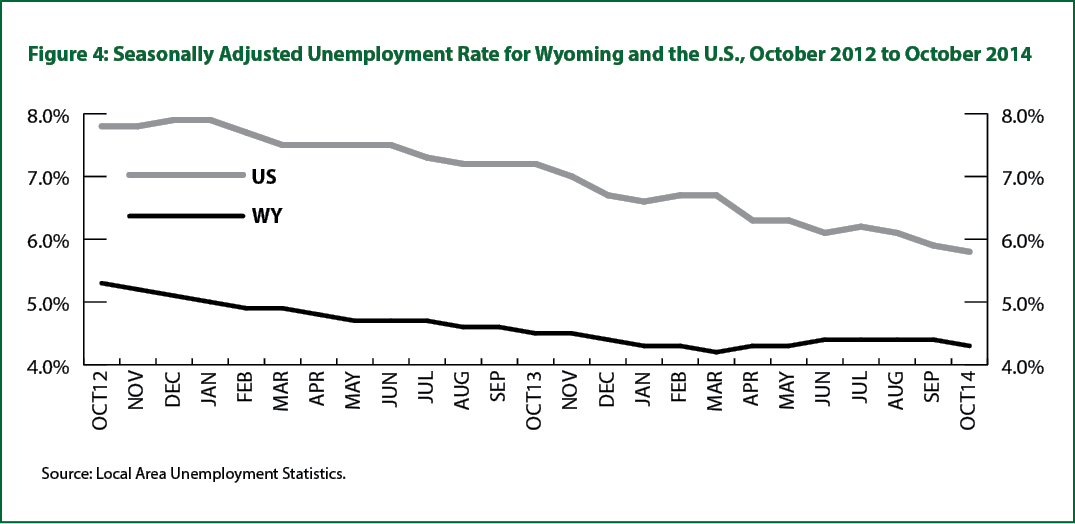
In all, leisure & hospitality, retail trade, and public administration employ the most individuals, but mining; wholesale trade, transportation, utilities, & warehousing; and manufacturing have the highest wages as well as the highest opportunity cost for students. On average, females earned less than males in every group, but students at the University of Wyoming had the smallest gender-wage gap. The data indicate a high employment to population ratio for college students in the state during the 2013-14 school year, which corresponds to the comparatively low unemployment rate in the state of Wyoming during this time (see Figure 4).
Future research could assess enrollment in higher education and employment by hours worked, as well as earnings and graduation outcomes. Furthermore, new reports could estimate the opportunity cost of individuals who choose not to attend college.
References
ACE Center for Policy Analysis. (2006, May). Working their way through college: Student employment and its impact on the college experience. In American Council on Education. Retrieved February 9, 2015 from http://www.acenet.edu/news-room/Documents/IssueBrief-2006-Working-their-way-through-College.pdf
Bullard, D. (2014). Wyoming unemployment rate unchanged at 4.7% in October 2014. Wyoming Labor Force Trends, 51(12). Retrieved August 11, 2015, from http://doe.state.wy.us/LMI/trends/1214/news.htm
Dunes, L., & Marx, J. (2006). Balancing work and academics in college: Why do students working 10 to 19 hours per week excel? College Student Retention: Research, Theory & Practice, 8(1), 107-120.
Gallagher, T., Glover, T., Hammer, L., Holmes, M., and Moore, M. (2015, April). Workforce Data Quality Initiative Report no. 1 for Wyoming: School Attendance and Employment, 2006 to 2013. Retrieved August 11, 2015, from http://doe.state.wy.us/LMI/education_we_connect/WDQI_Pub1.pdf
Harris, P. (2015). Youth transitions: Life events and labor market behavior. Wyoming Labor Force Trends, 52(5). Retrieved August 11, 2015, from http://doe.state.wy.us/LMI/trends/0515/a1.htm
Perna, L. W. (2010, July-August). Understanding the working college students. Academe, 96(4). Retrieved February 9, 2015, from http://www.aaup.org/article/understanding-working-college-student#.VOYeUPnF_mt
1For the purposes of this publication, the 2013-14 school year is equivalent to the third and fourth quarters of 2013 and the first and second quarters of 2014, or 2013Q3-2014Q2.
2For the purposes of this publication, R&P defines traditionally-aged college students as born between the years including 1989 and 1995, or of the ages 18-24 in 2013.
3The primary industry of an individual is the industry in which they have the highest earnings.