Current Employment Statistics Preliminary Benchmark: Downward Revision to Construction Offsets Upward Revisions
(Tables and Figures)
See Related Article
|
Reference Month |
Preliminary CES Estimates Produced |
QCEW Data Available |
|---|---|---|
| January | February | August |
| February | March | August |
| March | April | August |
| April | May | November |
| May | June | November |
| June | July | November |
| July | August | February |
| August | September | February |
| September | October | February |
| October | November | May |
| November | December | May |
| December | January | May |
| Industry |
March 2011 Published Estimate |
March 2011 Preliminary Benchmark |
Preliminary Benchmark Revision |
% Revision |
|---|---|---|---|---|
| Total Nonfarm Employment | 277,700 | 277,342 | -358 | -0.1% |
| Natural Resources & Mining | 26,100 | 26,237 | 137 | 0.5% |
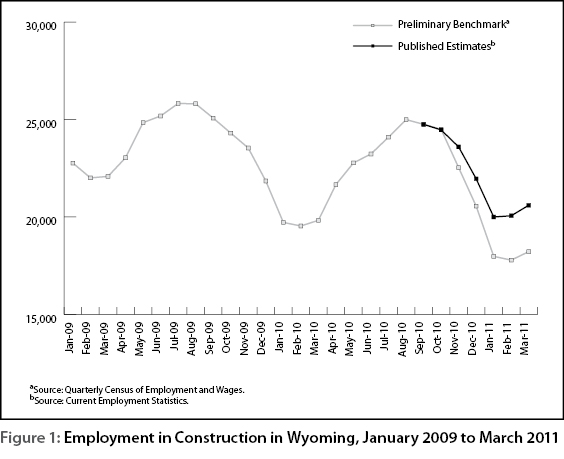
| Construction | 20,600 | 18,219 | -2,381 | -11.6% |
| Manufacturing | 8,700 | 8,649 | -51 | -0.6% |
| Wholesale Trade | 8,400 | 8,657 | 257 | 3.1% |
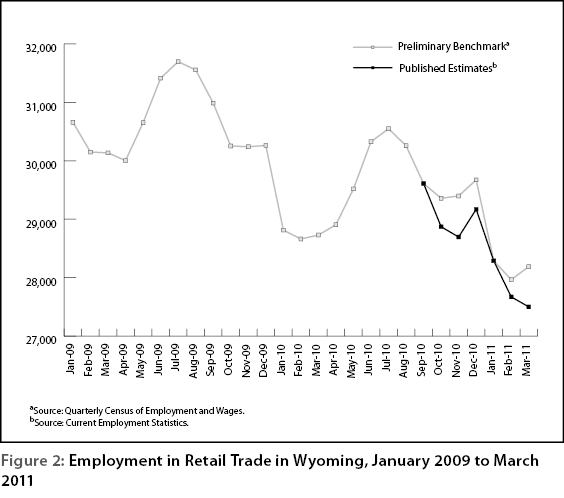
| Retail Trade | 27,500 | 28,189 | 689 | 2.5% |
| Transportation & Utilities | 14,100 | 13,915 | -185 | -1.3% |
| Information | 3,900 | 3,817 | -83 | -2.1% |
| Financial Activities | 10,700 | 10,644 | -56 | -0.5% |
| Professional & Business Services | 16,600 | 16,502 | -98 | -0.6% |
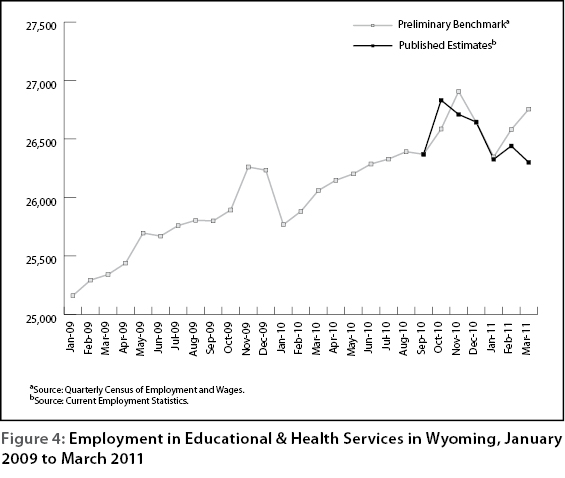
| Education & Health Services | 26,300 | 26,854 | 554 | 2.1% |
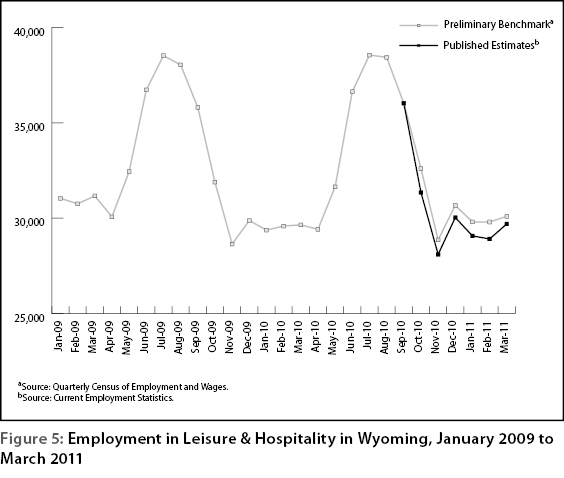
| Leisure & Hospitality | 29,700 | 30,098 | 398 | 1.3% |
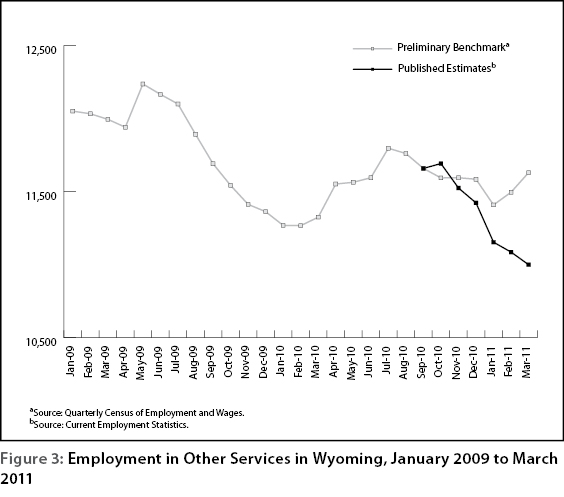
| Other Services | 11,000 | 11,556 | 556 | 5.1% |
| Government | 74,100 | 74,005 | -95 | -0.1% |
| Sources: Quarterly Cenus of Employment and Wages. Current Employment Statistics. | ||||