
Local Jobs and Payroll in Wyoming in First Quarter 2014:
Oil & Gas Jobs Come Back and Overall Job Growth Accelerates
(Tables and Figures)
Tables 1, 2, 3, 4, 5, 6
Figures 1, 2
|
Average Monthly Employment Percentage Change Over the Previous |
Total Wages Percentage Change Over the Previous |
Average Weekly Wage Percentage Change Over the Previous |
||||
|---|---|---|---|---|---|---|
| Year | Quarter | Year | Quarter | Year | Quarter | |
| 2010Q1 | -4.7 | -3.2 | -4.9 | -9.8 | -0.3 | -6.7 |
| 2011Q1 | 1.1 | -3.3 | 5.4 | -10.3 | 4.3 | -7.3 |
| 2012Q1 | 2.5 | -2.9 | 8.0 | -5.5 | 5.4 | -2.7 |
| 2013Q1 | 0.3 | -2.9 | 1.1 | -8.2 | 0.8 | -5.5 |
| 2014Q1a | 1.1 | -2.4 | 3.2 | -6.7 | 2.1 | -4.4 |
| Five-Year Average for Q1 | 0.1 | -2.9 | 2.6 | -8.1 | 2.4 | -5.3 |
| aPreliminary. Source: Quarterly Census of Employment and Wages, developed through a cooperative program between Research & Planning and the U.S. Bureau of Labor Statistics. Extract date: July 2014. |
||||||
| Average Monthly Employment | Total Wages | |
|---|---|---|
| aPreliminary.
Source: Quarterly Census of Employment and Wages, developed through a cooperative program between Research & Planning and the U.S. Bureau of Labor Statistics. Extract date: July 2014. |
||
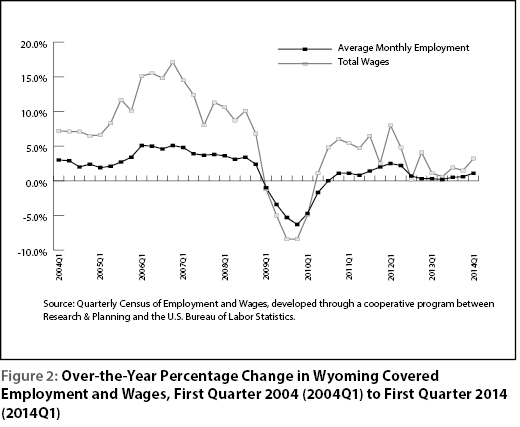
| 2004Q1 | 3.0 | 7.2 |
| 2004Q2 | 2.9 | 7.1 |
| 2004Q3 | 2.0 | 7.1 |
| 2004Q4 | 2.4 | 6.5 |
| 2005Q1 | 1.9 | 6.6 |
| 2005Q2 | 2.1 | 8.3 |
| 2005Q3 | 2.7 | 11.7 |
| 2005Q4 | 3.4 | 10.1 |
| 2006Q1 | 5.1 | 15.1 |
| 2006Q2 | 5.0 | 15.5 |
| 2006Q3 | 4.6 | 14.8 |
| 2006Q4 | 5.1 | 17.1 |
| 2007Q1 | 4.8 | 14.5 |
| 2007Q2 | 3.9 | 12.4 |
| 2007Q3 | 3.7 | 8.0 |
| 2007Q4 | 3.8 | 11.3 |
| 2008Q1 | 3.6 | 10.6 |
| 2008Q2 | 3.1 | 8.7 |
| 2008Q3 | 3.4 | 10.1 |
| 2008Q4 | 2.4 | 6.8 |
| 2009Q1 | -1.0 | -1.2 |
| 2009Q2 | -3.4 | -5.0 |
| 2009Q3 | -5.3 | -8.4 |
| 2009Q4 | -6.3 | -8.4 |
| 2010Q1 | -4.7 | -4.9 |
| 2010Q2 | -1.7 | 1.1 |
| 2010Q3 | 0.0 | 4.8 |
| 2010Q4 | 1.1 | 6.0 |
| 2011Q1 | 1.1 | 5.4 |
| 2011Q2 | 0.8 | 4.7 |
| 2011Q3 | 1.4 | 6.5 |
| 2011Q4 | 2.0 | 2.5 |
| 2012Q1 | 2.5 | 8.0 |
| 2012Q2 | 2.2 | 4.8 |
| 2012Q3 | 0.7 | 0.2 |
| 2012Q4 | 0.3 | 4.1 |
| 2013Q1 | 0.3 | 1.1 |
| 2013Q2 | 0.2 | 0.6 |
| 2013Q3 | 0.5 | 1.9 |
| 2013Q4 | 0.6 | 1.5 |
| 2014Q1a | 1.1 | 3.2 |
| Average Monthly Employment | Total Payroll | Average Weekly Wage | ||||||||||
|---|---|---|---|---|---|---|---|---|---|---|---|---|
| County | First Quarter | Change | First Quarter | Change | First Quarter | Change | ||||||
| 2013 | 2014 | n | % | 2013 | 2014 | $ | % | 2013 | 2014 | $ | % | |
| aPreliminary. bThe employer may be located statewide or in more than one county. Source: Quarterly Census of Employment and Wages, developed through a cooperative program between Research & Planning and the U.S. Bureau of Labor Statistics. Extract date: July 2014. |
||||||||||||
| Total | 270,881 | 273,943 | 3,062 | 1.1 | $3,024,233,488 | $3,121,576,339 | $97,342,851 | 3.2 | $859 | $877 | $18 | 2.1 |
| Albany | 15,199 | 15,251 | 52 | 0.3 | $136,472,959 | $140,011,813 | $3,538,854 | 2.6 | $691 | $706 | $15 | 2.2 |
| Big Horn | 4,085 | 4,044 | -41 | -1.0 | 36,991,745 | 38,820,728 | 1,828,983 | 4.9 | 697 | 738 | 41 | 5.9 |
| Campbell | 27,030 | 27,525 | 495 | 1.8 | 382,029,072 | 393,456,867 | 11,427,795 | 3.0 | 1,087 | 1,100 | 13 | 1.2 |
| Carbon | 6,662 | 7,093 | 431 | 6.5 | 69,347,583 | 86,883,322 | 17,535,739 | 25.3 | 801 | 942 | 141 | 17.6 |
| Converse | 5,982 | 6,298 | 316 | 5.3 | 66,095,825 | 73,783,253 | 7,687,428 | 11.6 | 850 | 901 | 51 | 6.0 |
| Crook | 2,232 | 2,271 | 39 | 1.7 | 20,431,104 | 21,291,054 | 859,950 | 4.2 | 704 | 721 | 17 | 2.4 |
| Fremont | 16,488 | 16,113 | -375 | -2.3 | 159,476,070 | 159,532,500 | 56,430 | 0.0 | 744 | 762 | 18 | 2.4 |
| Goshen | 4,511 | 4,479 | -32 | -0.7 | 36,466,630 | 37,372,602 | 905,972 | 2.5 | 622 | 642 | 20 | 3.2 |
| Hot Springs | 2,073 | 2,054 | -19 | -0.9 | 17,226,611 | 17,947,140 | 720,529 | 4.2 | 639 | 672 | 33 | 5.2 |
| Johnson | 3,190 | 3,250 | 60 | 1.9 | 27,067,777 | 29,194,327 | 2,126,550 | 7.9 | 653 | 691 | 38 | 5.8 |
| Laramie | 43,476 | 44,696 | 1,220 | 2.8 | 462,507,155 | 476,133,331 | 13,626,176 | 2.9 | 818 | 819 | 1 | 0.1 |
| Lincoln | 5,429 | 5,459 | 30 | 0.6 | 55,831,340 | 56,782,967 | 951,627 | 1.7 | 791 | 800 | 9 | 1.1 |
| Natrona | 40,925 | 41,379 | 454 | 1.1 | 480,157,150 | 503,047,259 | 22,890,109 | 4.8 | 903 | 935 | 32 | 3.5 |
| Niobrara | 904 | 935 | 31 | 3.4 | 7,127,133 | 8,623,641 | 1,496,508 | 21.0 | 606 | 709 | 103 | 17.0 |
| Park | 12,495 | 12,517 | 22 | 0.2 | 120,925,522 | 122,420,477 | 1,494,955 | 1.2 | 744 | 752 | 8 | 1.1 |
| Platte | 3,391 | 3,313 | -78 | -2.3 | 32,322,741 | 32,897,345 | 574,604 | 1.8 | 733 | 764 | 31 | 4.2 |
| Sheridan | 12,308 | 12,626 | 318 | 2.6 | 114,869,460 | 118,792,886 | 3,923,426 | 3.4 | 718 | 724 | 6 | 0.8 |
| Sublette | 4,744 | 4,621 | -123 | -2.6 | 72,253,015 | 74,623,720 | 2,370,705 | 3.3 | 1,172 | 1,242 | 70 | 6.0 |
| Sweetwater | 24,430 | 24,140 | -290 | -1.2 | 346,121,487 | 354,528,441 | 8,406,954 | 2.4 | 1,090 | 1,130 | 40 | 3.7 |
| Teton | 16,652 | 17,494 | 842 | 5.1 | 178,565,826 | 173,131,813 | -5,434,013 | -3.0 | 825 | 761 | -64 | -7.8 |
| Uinta | 8,747 | 8,614 | -133 | -1.5 | 90,271,386 | 89,324,543 | -946,843 | -1.0 | 794 | 798 | 4 | 0.5 |
| Washakie | 3,674 | 3,631 | -43 | -1.2 | 33,435,354 | 34,896,624 | 1,461,270 | 4.4 | 700 | 739 | 39 | 5.6 |
| Weston | 2,234 | 2,281 | 47 | 2.1 | 20,742,253 | 21,127,129 | 384,876 | 1.9 | 714 | 712 | -2 | -0.3 |
| Nonclassifiedb | 4,018 | 3,859 | -159 | -4.0 | 57,498,290 | 56,952,557 | -545,733 | -0.9 | 1,101 | 1,135 | 35 | 3.1 |
| Average Monthly Employment | Total Payroll | Average Weekly Wage | ||||||||||
|---|---|---|---|---|---|---|---|---|---|---|---|---|
| NAICSb Title | First Quarter | Change | First Quarter | Change | First Quarter | Change | ||||||
| 2013 | 2014 | n | % | 2013 | 2014 | $ | % | 2013 | 2014 | $ | % | |
| aPreliminary. bNorth American Industry Classification System. ND-Not disclosable due to confidentiality of information. Source: Quarterly Census of Employment and Wages, developed through a cooperative program between Research & Planning and the U.S. Bureau of Labor Statistics. Extract date: July 2014. |
||||||||||||
| Total, All Industries | 40,925 | 41,379 | 454 | 1.1 | $480,157,150 | $503,047,259 | $22,890,109 | 4.8 | $903 | $935 | $32 | 3.5 |
| Total Private | 35,201 | 35,598 | 397 | 1.1 | $411,626,222 | $433,366,938 | $21,740,716 | 5.3 | $900 | $936 | $36 | 4.0 |
| Agriculture | 111 | 113 | 2 | 1.8 | 615,869 | 666,012 | 50,143 | 8.1 | 427 | 453 | 26 | 6.1 |
| Mining | 3,988 | 4,098 | 110 | 2.8 | 90,616,388 | 99,835,109 | 9,218,721 | 10.2 | 1,748 | 1,874 | 126 | 7.2 |
| Utilities | 136 | 143 | 7 | 5.1 | 2,060,198 | 2,422,693 | 362,495 | 17.6 | 1,165 | 1,303 | 138 | 11.8 |
| Construction | 2,892 | 3,106 | 214 | 7.4 | 36,282,091 | 39,018,551 | 2,736,460 | 7.5 | 965 | 966 | 1 | 0.1 |
| Manufacturing | 1,776 | 1,767 | -9 | -0.5 | 24,027,240 | 25,874,595 | 1,847,355 | 7.7 | 1,041 | 1,126 | 85 | 8.2 |
| Wholesale Trade | 2,736 | 2,739 | 3 | 0.1 | 41,176,659 | 43,277,145 | 2,100,486 | 5.1 | 1,158 | 1,215 | 57 | 4.9 |
| Retail Trade | 4,722 | 4,781 | 59 | 1.2 | 32,736,825 | 32,978,618 | 241,793 | 0.7 | 533 | 531 | -2 | -0.4 |
| Transportation & Warehousing | 1,235 | 1,218 | -17 | -1.4 | 16,673,712 | 17,102,723 | 429,011 | 2.6 | 1,039 | 1,080 | 41 | 3.9 |
| Information | 451 | 435 | -16 | -3.5 | 4,448,449 | 4,571,428 | 122,979 | 2.8 | 759 | 808 | 49 | 6.5 |
| Finance & Insurance | 1,051 | 1,052 | 1 | 0.1 | 16,485,907 | 17,195,648 | 709,741 | 4.3 | 1,207 | 1,257 | 50 | 4.1 |
| Real Estate & Rental & Leasing | 945 | 974 | 29 | 3.1 | 12,411,411 | 12,933,558 | 522,147 | 4.2 | 1,010 | 1,021 | 11 | 1.1 |
| Professional & Technical Services | 1,515 | 1,536 | 21 | 1.4 | 19,940,619 | 20,977,117 | 1,036,498 | 5.2 | 1,012 | 1,051 | 39 | 3.9 |
| Mgmt. of Companies & Enterprises | 209 | 212 | 3 | 1.4 | 4,370,910 | 4,406,173 | 35,263 | 0.8 | 1,609 | 1,599 | -10 | -0.6 |
| Administrative & Waste Services | 1,204 | 1,253 | 49 | 4.1 | 9,282,981 | 9,748,979 | 465,998 | 5.0 | 593 | 599 | 6 | 1.0 |
| Educational Services | 162 | 148 | -14 | -8.6 | 860,776 | 781,625 | -79,151 | -9.2 | 409 | 406 | -3 | -0.7 |
| Health Care & Social Assistance | 5,694 | 5,824 | 130 | 2.3 | 61,107,755 | 66,499,989 | 5,392,234 | 8.8 | 826 | 878 | 52 | 6.3 |
| Ambulatory Health Care Services | 2,022 | 2,140 | 118 | 5.8 | 28,063,145 | 32,784,395 | 4,721,250 | 16.8 | 1,068 | 1,178 | 110 | 10.3 |
| Hospitals | 1,627 | 1,622 | -5 | -0.3 | 20,635,657 | 20,932,505 | 296,848 | 1.4 | 976 | 993 | 17 | 1.7 |
| Nursing & Res.Care Facilities | 970 | 955 | -15 | -1.5 | 7,015,448 | 7,297,980 | 282,532 | 4.0 | 556 | 588 | 32 | 5.8 |
| Social assistance | 1,075 | 1,108 | 33 | 3.1 | 5,393,505 | 5,485,109 | 91,604 | 1.7 | 386 | 381 | -5 | -1.3 |
| Arts, Entertainment, & Recreation | 402 | 428 | 26 | 6.5 | 1,360,298 | 1,471,006 | 110,708 | 8.1 | 260 | 264 | 4 | 1.5 |
| Accommodation & Food Services | 3,942 | 4,039 | 97 | 2.5 | 15,331,173 | 16,351,442 | 1,020,269 | 6.7 | 299 | 311 | 12 | 4.0 |
| Other Services | 2,029 | 1,730 | -299 | -14.7 | 21,836,961 | 17,254,527 | -4,582,434 | -21.0 | 828 | 767 | -61 | -7.4 |
| Total Government | 5,724 | 5,781 | 57 | 1.0 | $68,530,928 | $69,680,321 | $1,149,393 | 1.7 | $921 | $927 | $6 | 0.7 |
| Federal Government | 648 | 629 | -19 | -2.9 | 10,798,239 | 10,865,635 | 67,396 | 0.6 | 1,282 | 1,329 | 47 | 3.7 |
| State Government | 713 | 708 | -5 | -0.7 | 9,606,700 | 9,496,417 | -110,283 | -1.1 | 1,036 | 1,032 | -4 | -0.4 |
| Local Government | 4,363 | 4,444 | 81 | 1.9 | 48,125,989 | 49,318,269 | 1,192,280 | 2.5 | 848 | 854 | 6 | 0.7 |
| Local Government Education | ND | ND | ND | ND | ND | ND | ND | ND | ND | ND | ND | ND |
| NAICSb Title | Average Monthly Employment | Total Payroll | Average Weekly Wage | |||||||||
|---|---|---|---|---|---|---|---|---|---|---|---|---|
| First Quarter | Change | First Quarter | Change | First Quarter | Change | |||||||
| 2013 | 2014 | n | % | 2013 | 2014 | $ | % | 2013 | 2014 | $ | % | |
|
aPreliminary.
bNorth American Industry Classification System. Source: Quarterly Census of Employment and Wages, developed through a cooperative program between Research & Planning and the U.S. Bureau of Labor Statistics. Extract date: July 2014. |
||||||||||||
| Total, All Industries | 43,476 | 44,696 | 1,220 | 2.8 | $462,507,155 | $476,133,331 | $13,626,176 | 2.9 | $818 | $819 | $1 | 0.1 |
| Total Private | 29,669 | 30,991 | 1,322 | 4.5 | $282,136,618 | $294,692,882 | $12,556,264 | 4.5 | $731 | $731 | $0 | 0.0 |
| Agriculture | 306 | 316 | 10 | 3.3 | 2,162,447 | 2,351,847 | 189,400 | 8.8 | 544 | 573 | 29 | 5.3 |
| Mining | 195 | 346 | 151 | 77.4 | 3,406,945 | 6,562,830 | 3,155,885 | 92.6 | 1,344 | 1,459 | 115 | 8.6 |
| Utilities | 143 | 157 | 14 | 9.8 | 2,879,500 | 3,339,730 | 460,230 | 16.0 | 1,549 | 1,636 | 87 | 5.6 |
| Construction | 2,685 | 2,876 | 191 | 7.1 | 27,569,396 | 31,945,047 | 4,375,651 | 15.9 | 790 | 854 | 64 | 8.1 |
| Manufacturing | 1,321 | 1,380 | 59 | 4.5 | 17,445,556 | 20,989,074 | 3,543,518 | 20.3 | 1,016 | 1,170 | 154 | 15.2 |
| Wholesale Trade | 925 | 976 | 51 | 5.5 | 12,006,926 | 13,320,398 | 1,313,472 | 10.9 | 998 | 1,050 | 52 | 5.2 |
| Retail Trade | 5,331 | 5,309 | -22 | -0.4 | 34,764,460 | 35,512,935 | 748,475 | 2.2 | 502 | 515 | 13 | 2.6 |
| Transportation & Warehousing | 2,428 | 2,944 | 516 | 21.3 | 25,898,122 | 30,817,610 | 4,919,488 | 19.0 | 820 | 805 | -15 | -1.8 |
| Information | 1,127 | 1,139 | 12 | 1.1 | 12,525,665 | 13,166,954 | 641,289 | 5.1 | 855 | 889 | 34 | 4.0 |
| Finance & Insurance | 1,630 | 1,665 | 35 | 2.1 | 20,911,411 | 23,049,662 | 2,138,251 | 10.2 | 987 | 1,065 | 78 | 7.9 |
| Real Estate & Rental & Leasing | 545 | 564 | 19 | 3.5 | 5,801,848 | 5,837,265 | 35,417 | 0.6 | 819 | 796 | -23 | -2.8 |
| Professional & Technical Services | 1,593 | 1,614 | 21 | 1.3 | 19,939,163 | 21,273,851 | 1,334,688 | 6.7 | 963 | 1,014 | 51 | 5.3 |
| Mgmt. of Companies & Enterprises | 89 | 86 | -3 | -3.4 | 1,625,099 | 1,464,185 | -160,914 | -9.9 | 1,405 | 1,310 | -95 | -6.8 |
| Administrative & Waste Services | 1,497 | 1,558 | 61 | 4.1 | 9,268,662 | 9,408,249 | 139,587 | 1.5 | 476 | 465 | -11 | -2.3 |
| Educational Services | 258 | 256 | -2 | -0.8 | 1,525,996 | 1,616,253 | 90,257 | 5.9 | 455 | 486 | 31 | 6.8 |
| Health Care & Social Assistance | 3,966 | 4,031 | 65 | 1.6 | 40,888,763 | 41,873,771 | 985,008 | 2.4 | 793 | 799 | 6 | 0.8 |
| Ambulatory Health Care Services | 1,964 | 2,016 | 52 | 2.6 | 28,385,818 | 29,181,686 | 795,868 | 2.8 | 1,112 | 1,113 | 1 | 0.1 |
| Nursing & Res. Care Facilities | 850 | 860 | 10 | 1.2 | 6,208,902 | 6,391,324 | 182,422 | 2.9 | 562 | 572 | 10 | 1.8 |
| Hospitals & Social Assistance | 1,150 | 1,155 | 5 | 0.4 | 6,294,043 | 6,300,761 | 6,718 | 0.1 | 421 | 420 | -1 | -0.3 |
| Arts, Entertainment, & Recreation | 270 | 269 | -1 | -0.4 | 863,328 | 1,046,053 | 182,725 | 21.2 | 246 | 299 | 53 | 21.5 |
| Accommodation & Food Services | 4,075 | 4,253 | 178 | 4.4 | 33,595,208 | 21,886,505 | -11,708,703 | -34.9 | 634 | 396 | -238 | -37.5 |
| Other Services | 1,287 | 1,251 | -36 | -2.8 | 9,058,123 | 9,230,663 | 172,540 | 1.9 | 541 | 568 | 27 | 5.0 |
| Total Government | 13,807 | 13,706 | -101 | -0.7 | $180,370,537 | $181,440,449 | $1,069,912 | 0.6 | $1,005 | $1,018 | $13 | 1.3 |
| Federal Government | 2,568 | 2,530 | -38 | -1.5 | 42,168,168 | 42,857,684 | 689,516 | 1.6 | 1,263 | 1,303 | 40 | 3.2 |
| State Government | 4,049 | 3,988 | -61 | -1.5 | 58,149,355 | 57,660,125 | -489,230 | -0.8 | 1,105 | 1,112 | 7 | 0.6 |
| Local Government | 7,190 | 7,188 | -2 | -0.0 | 80,053,014 | 80,922,640 | 869,626 | 1.1 | 856 | 866 | 10 | 1.2 |
| Local Government Education | 3,779 | 3,817 | 38 | 1.0 | 38,156,627 | 39,584,631 | 1,428,004 | 3.7 | 777 | 798 | 21 | 2.7 |
| Average Monthly Employment | Total Payroll | Average Weekly Wage | ||||||||||
|---|---|---|---|---|---|---|---|---|---|---|---|---|
| First Quarter | Change | First Quarter | Change | First Quarter | Change | |||||||
| NAICSb Title | 2013 | 2014 | n | % | 2013 | 2014 | $ | % | 2013 | 2014 | $ | % |
| aPreliminary. bNorth American Industry Classification System. Source: Quarterly Census of Employment and Wages, developed through a cooperative program between Research & Planning and the U.S. Bureau of Labor Statistics. Extract date: July 2014. |
||||||||||||
| Total, All Industries | 270,881 | 273,943 | 3,062 | 1.1 | $3,024,233,488 | $3,121,576,339 | $97,342,851 | 3.2 | $859 | $877 | $18 | 2.1 |
| Total Private | 203,731 | 207,127 | 3,396 | 1.7 | $2,275,948,452 | $2,364,971,685 | $89,023,233 | 3.9 | $859 | $878 | $19 | 2.2 |
| Agriculture | 2,262 | 2,307 | 45 | 2.0 | 16,696,058 | 17,871,382 | 1,175,324 | 7.0 | 568 | 596 | 28 | 4.9 |
| Mining | 26,477 | 26,843 | 366 | 1.4 | 578,160,686 | 608,969,036 | 30,808,350 | 5.3 | 1,680 | 1,745 | 65 | 3.9 |
| Utilities | 2,470 | 2,451 | -19 | -0.8 | 46,264,319 | 48,870,631 | 2,606,312 | 5.6 | 1,441 | 1,534 | 93 | 6.5 |
| Construction | 19,129 | 20,367 | 1,238 | 6.5 | 221,343,070 | 242,222,540 | 20,879,470 | 9.4 | 890 | 915 | 25 | 2.8 |
| Manufacturing | 9,271 | 9,580 | 309 | 3.3 | 132,487,032 | 148,169,451 | 15,682,419 | 11.8 | 1,099 | 1,190 | 91 | 8.3 |
| Wholesale Trade | 9,068 | 9,263 | 195 | 2.2 | 127,598,682 | 132,457,281 | 4,858,599 | 3.8 | 1,082 | 1,100 | 18 | 1.7 |
| Retail Trade | 28,459 | 28,618 | 159 | 0.6 | 188,179,967 | 191,745,349 | 3,565,382 | 1.9 | 509 | 515 | 6 | 1.2 |
| Transportation & Warehousing | 9,627 | 10,182 | 555 | 5.8 | 112,394,839 | 123,285,714 | 10,890,875 | 9.7 | 898 | 931 | 33 | 3.7 |
| Information | 3,785 | 3,756 | -29 | -0.8 | 39,564,150 | 40,164,061 | 599,911 | 1.5 | 804 | 823 | 19 | 2.4 |
| Finance & Insurance | 6,723 | 6,737 | 14 | 0.2 | 93,638,222 | 98,924,393 | 5,286,171 | 5.6 | 1,071 | 1,130 | 59 | 5.5 |
| Real Estate & Rental & Leasing | 4,151 | 4,289 | 138 | 3.3 | 46,394,267 | 50,661,582 | 4,267,315 | 9.2 | 860 | 909 | 49 | 5.7 |
| Professional & Technical Services | 9,302 | 9,387 | 85 | 0.9 | 117,724,953 | 126,653,755 | 8,928,802 | 7.6 | 974 | 1,038 | 64 | 6.6 |
| Mgmt. of Companies & Enterprises | 1,047 | 1,003 | -44 | -4.2 | 48,072,715 | 27,819,964 | -20,252,751 | -42.1 | 3,532 | 2,134 | -1,398 | -39.6 |
| Administrative & Waste Services | 6,726 | 6,892 | 166 | 2.5 | 50,331,400 | 51,603,349 | 1,271,949 | 2.5 | 576 | 576 | 0 | 0.0 |
| Educational Services | 1,787 | 1,723 | -64 | -3.6 | 12,170,375 | 12,347,377 | 177,002 | 1.5 | 524 | 551 | 27 | 5.2 |
| Health Care & Social Assistance | 23,819 | 23,923 | 104 | 0.4 | 223,441,864 | 230,108,253 | 6,666,389 | 3.0 | 722 | 740 | 18 | 2.5 |
| Ambulatory Health Care Services | 9,233 | 9,523 | 290 | 3.1 | 118,916,224 | 125,025,121 | 6,108,897 | 5.1 | 991 | 1,010 | 19 | 1.9 |
| Hospitals | 3,049 | 3,005 | -44 | -1.4 | 36,931,545 | 37,436,733 | 505,188 | 1.4 | 932 | 958 | 26 | 2.8 |
| Nursing & Res. Care Facilities | 4,601 | 4,491 | -110 | -2.4 | 32,350,700 | 32,096,419 | -254,281 | -0.8 | 541 | 550 | 9 | 1.7 |
| Social Assistance | 6,937 | 6,904 | -33 | -0.5 | 35,243,395 | 35,549,980 | 306,585 | 0.9 | 391 | 396 | 5 | 1.3 |
| Arts, Entertainment, & Recreation | 2,436 | 2,480 | 44 | 1.8 | 10,586,796 | 12,035,686 | 1,448,890 | 13.7 | 334 | 373 | 39 | 11.7 |
| Accommodation & Food Services | 29,045 | 29,636 | 591 | 2.0 | 140,775,752 | 135,821,329 | -4,954,423 | -3.5 | 373 | 353 | -20 | -5.4 |
| Other Services | 8,147 | 7,689 | -458 | -5.6 | 70,123,305 | 65,240,552 | -4,882,753 | -7.0 | 662 | 653 | -9 | -1.4 |
| Total Government | 67,150 | 66,815 | -335 | -0.5 | $748,285,036 | $756,604,654 | $8,319,618 | 1.1 | $857 | $871 | $14 | 1.6 |
| Federal Government | 6,981 | 6,936 | -45 | -0.6 | 104,670,713 | 107,982,895 | 3,312,182 | 3.2 | 1,153 | 1,198 | 45 | 3.9 |
| State Government | 13,238 | 13,068 | -170 | -1.3 | 172,286,846 | 171,360,923 | -925,923 | -0.5 | 1,001 | 1,009 | 8 | 0.8 |
| State Government Education | 3,564 | 3,551 | -14 | -0.4 | 44,066,524 | 44,495,335 | 428,811 | 1.0 | 951 | 964 | 13 | 1.4 |
| Local Government | 46,931 | 46,811 | -120 | -0.3 | 471,327,477 | 477,260,836 | 5,933,359 | 1.3 | 773 | 784 | 11 | 1.4 |
| Local Government Education | 24,733 | 24,651 | -82 | -0.3 | 237,393,828 | 239,323,595 | 1,929,767 | 0.8 | 738 | 747 | 8 | 1.1 |
| Hospitals | 6,996 | 7,041 | 45 | 0.6 | 92,195,391 | 95,025,076 | 2,829,685 | 3.1 | 1,014 | 1,038 | 24 | 2.4 |