
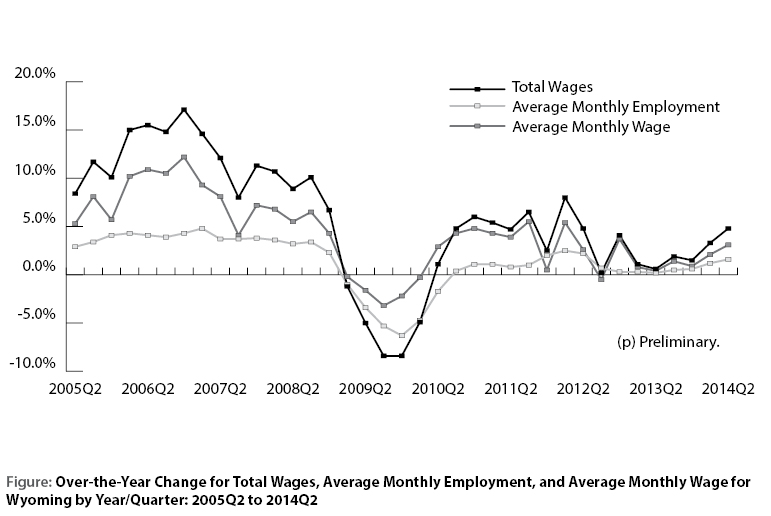
Total Wages, Average Monthly Employment, and Average Monthly Wage Changes for Wyoming by Year/Quarter: 2005Q2 to 2014Q2
| Year/ Quarter |
Total Wages |
% Change |
Avg. Monthly Employment |
% Change |
Avg. Monthly Wage |
% Change |
|---|---|---|---|---|---|---|
| 2005/2 | $2,068,675,609 | 258,031 | $2,672.39 | |||
| 2006/2 | $2,389,394,775 | 15.5% | 268,726 | 4.1% | $2,963.86 | 10.9% |
| 2005/3 | $2,188,006,458 | 263,747 | $2,765.28 | |||
| 2006/3 | $2,511,603,105 | 14.8% | 274,060 | 3.9% | $3,054.81 | 10.5% |
| 2005/4 | $2,283,976,604 | 259,256 | $2,936.58 | |||
| 2006/4 | $2,674,775,271 | 17.1% | 270,498 | 4.3% | $3,296.11 | 12.2% |
| 2006/1 | $2,206,882,734 | 254,302 | $2,892.73 | |||
| 2007/1 | $2,528,871,913 | 14.6% | 266,599 | 4.8% | $3,161.89 | 9.3% |
| 2006/2 | $2,389,394,775 | 268,726 | $2,963.86 | |||
| 2007/2 | $2,679,641,341 | 12.1% | 278,792 | 3.7% | $3,203.87 | 8.1% |
| 2006/3 | $2,511,603,105 | 274,060 | $3,054.81 | |||
| 2007/3 | $2,712,325,140 | 8.0% | 284,317 | 3.7% | $3,179.93 | 4.1% |
| 2006/4 | $2,674,775,271 | 270,498 | $3,296.11 | |||
| 2007/4 | $2,976,397,551 | 11.3% | 280,888 | 3.8% | $3,532.13 | 7.2% |
| 2007/1 | $2,528,871,913 | 266,599 | $3,161.89 | |||
| 2008/1 | $2,798,237,273 | 10.7% | 276,195 | 3.6% | $3,377.13 | 6.8% |
| 2007/2 | $2,679,641,341 | 278,792 | $3,203.87 | |||
| 2008/2 | $2,918,008,721 | 8.9% | 287,780 | 3.2% | $3,379.91 | 5.5% |
| 2007/3 | $2,712,325,140 | 284,317 | $3,179.93 | |||
| 2008/3 | $2,985,771,294 | 10.1% | 293,895 | 3.4% | $3,386.44 | 6.5% |
| 2007/4 | $2,976,397,551 | 280,888 | $3,532.13 | |||
| 2008/4 | $3,177,223,682 | 6.7% | 287,478 | 2.3% | $3,684.02 | 4.3% |
| 2008/1 | $2,798,237,273 | 276,195 | $3,377.13 | |||
| 2009/1 | $2,764,364,307 | -1.2% | 273,471 | -1.0% | $3,369.48 | -0.2% |
| 2008/2 | $2,918,008,721 | 287,780 | $3,379.91 | |||
| 2009/2 | $2,773,191,493 | -5.0% | 277,897 | -3.4% | $3,326.40 | -1.6% |
| 2008/3 | $2,985,771,294 | 293,895 | $3,386.44 | |||
| 2009/3 | $2,736,056,780 | -8.4% | 278,234 | -5.3% | $3,277.88 | -3.2% |
| 2008/4 | $3,177,223,682 | 287,478 | $3,684.02 | |||
| 2009/4 | $2,911,594,084 | -8.4% | 269,439 | -6.3% | $3,602.04 | -2.2% |
| 2009/1 | $2,764,364,307 | 273,471 | $3,369.48 | |||
| 2010/1 | $2,627,558,836 | -4.9% | 260,726 | -4.7% | $3,359.29 | -0.3% |
| 2009/2 | $2,773,191,493 | 277,897 | $3,326.40 | |||
| 2010/2 | $2,802,848,365 | 1.1% | 273,044 | -1.7% | $3,421.73 | 2.9% |
| 2009/3 | $2,736,056,780 | 278,234 | $3,277.88 | |||
| 2010/3 | $2,866,694,334 | 4.8% | 279,429 | 0.4% | $3,419.71 | 4.3% |
| 2009/4 | $2,911,594,084 | 269,439 | $3,602.04 | |||
| 2010/4 | $3,087,069,661 | 6.0% | 272,511 | 1.1% | $3,776.08 | 4.8% |
| 2010/1 | $2,627,558,836 | 260,726 | $3,359.29 | |||
| 2011/1 | $2,769,072,169 | 5.4% | 263,558 | 1.1% | $3,502.17 | 4.3% |
| 2010/2 | $2,802,848,365 | 273,044 | $3,421.73 | |||
| 2011/2 | $2,933,492,659 | 4.7% | 275,169 | 0.8% | $3,553.56 | 3.9% |
| 2010/3 | $2,866,694,334 | 279,429 | $3,419.71 | |||
| 2011/3 | $3,053,914,162 | 6.5% | 282,231 | 1.0% | $3,606.87 | 5.5% |
| 2010/4 | $3,087,069,661 | 272,511 | $3,776.08 | |||
| 2011/4 | $3,165,745,021 | 2.5% | 278,015 | 2.0% | $3,795.65 | 0.5% |
| 2011/1 | $2,769,072,169 | 263,558 | $3,502.17 | |||
| 2012/1 | $2,991,246,352 | 8.0% | 270,073 | 2.5% | $3,691.90 | 5.4% |
| 2011/2 | $2,933,492,659 | 275,169 | $3,553.56 | |||
| 2012/2 | $3,074,207,136 | 4.8% | 281,192 | 2.2% | $3,644.26 | 2.6% |
| 2011/3 | $3,053,914,162 | 282,231 | $3,606.87 | |||
| 2012/3 | $3,060,122,560 | 0.2% | 284,180 | 0.7% | $3,589.42 | -0.5% |
| 2011/4 | $3,165,745,021 | 278,015 | $3,795.65 | |||
| 2012/4 | $3,294,064,060 | 4.1% | 278,934 | 0.3% | $3,936.49 | 3.7% |
| 2012/1 | $2,991,246,352 | 270,073 | $3,691.90 | |||
| 2013/1 | $3,024,233,488 | 1.1% | 270,881 | 0.3% | $3,721.48 | 0.8% |
| 2012/2 | $3,074,207,136 | 281,192 | $3,644.26 | |||
| 2013/2 | $3,093,096,086 | 0.6% | 281,707 | 0.2% | $3,659.94 | 0.4% |
| 2012/3 | $3,060,122,560 | 284,180 | $3,589.42 | |||
| 2013/3 | $3,119,244,931 | 1.9% | 285,726 | 0.5% | $3,638.97 | 1.4% |
| 2012/4 | $3,294,064,060 | 278,934 | $3,936.49 | |||
| 2013/4 | $3,344,359,716 | 1.5% | 280,701 | 0.6% | $3,971.44 | 0.9% |
| 2013/1 | $3,024,233,488 | 270,881 | $3,721.48 | |||
| 2014/1 | $3,124,158,426 | 3.3% | 274,050 | 1.2% | $3,799.99 | 2.1% |
| 2013/2 | $3,093,096,086 | 281,707 | $3,659.94 | |||
| 2014/2(p) | $3,241,566,139 | 4.8% | 286,269 | 1.6% | $3,774.50 | 3.1% |
 |
||||||
|
(p) Preliminary.
Source: Quarterly Census of Employment and Wages. |
||||||