Economic Indicators
The consumer price index rose 1.5% from August 2012 to August 2013.
| Aug | Jul | Aug | Percent Change | ||||
|---|---|---|---|---|---|---|---|
| 2013 (p) | 2013 (r) | 2012 (b) | Month | Year | |||
| Wyoming Total Nonfarm Employment | 300,200 | 301,800 | 296,600 | -0.5 | 1.2 | ||
| Wyoming State Government | 16,100 | 16,500 | 16,200 | -2.4 | -0.6 | ||
| Laramie County Nonfarm Employment | 46,800 | 47,600 | 45,300 | -1.7 | 3.3 | ||
| Natrona County Nonfarm Employment | 41,800 | 42,000 | 41,500 | -0.5 | 0.7 | ||
| Selected U.S. Employment Data | |||||||
| U.S. Multiple Jobholders | 6,776,000 | 6,897,000 | 6,635,000 | -1.8 | 2.1 | ||
| As a percent of all workers | 4.7% | 4.8% | 4.7% | N/A | N/A | ||
| U.S. Discouraged Workers | 866,000 | 988,000 | 844,000 | -12.3 | 2.6 | ||
| U.S. Part Time for Economic Reasons | 7,690,000 | 8,324,000 | 7,842,000 | -7.6 | -1.9 | ||
| Wyoming Unemployment Insurance | |||||||
| Weeks Compensated | 12,791 | 16,013 | 15,070 | -20.1 | -15.1 | ||
| Benefits Paid | $4,623,227 | $5,766,129 | $5,214,792 | -19.8 | -11.3 | ||
| Average Weekly Benefit Payment | $361.44 | $360.09 | $346.04 | 0.4 | 4.5 | ||
| State Insured Covered Jobs1 | 274,280 | 273,463 | 270,433 | 0.3 | 1.4 | ||
| Insured Unemployment Rate | 1.8% | 1.9% | 2.0% | N/A | N/A | ||
| Consumer Price Index (U) for All U.S. Urban Consumers | |||||||
| (1982 to 1984 = 100) | |||||||
| All Items | 233.9 | 233.6 | 230.4 | 0.1 | 1.5 | ||
| Food & Beverages | 237.3 | 237.0 | 234.0 | 0.2 | 1.4 | ||
| Housing | 228.6 | 228.4 | 223.7 | 0.1 | 2.2 | ||
| Apparel | 125.8 | 124.2 | 123.6 | 1.2 | 1.8 | ||
| Transportation | 219.2 | 220.0 | 219.1 | -0.4 | 0.0 | ||
| Medical Care | 426.9 | 424.8 | 417.1 | 0.5 | 2.3 | ||
| Recreation (Dec. 1997=100) | 115.3 | 115.4 | 114.9 | 0.0 | 0.4 | ||
| Education & Communication (Dec. 1997=100) | 136.1 | 135.3 | 134.0 | 0.6 | 1.6 | ||
| Other Goods & Services | 402.4 | 401.5 | 396.2 | 0.2 | 1.6 | ||
| Producer Prices (1982 to 1984 = 100) | |||||||
| All Commodities | 204.3 | 204.6 | 202.7 | -0.1 | 0.8 | ||
| Wyo. Bldg. Permits (New Privately Owned Housing Units Authorized) | |||||||
| Total Units | 167 | 193 | 332 | -13.5 | -49.7 | ||
| Valuation | $41,402,000 | $50,108,000 | $60,010,000 | -17.4 | -31.0 | ||
| Single Family Homes | 136 | 160 | 164 | -15.0 | -17.1 | ||
| Valuation | $39,414,000 | $47,947,000 | $48,835,000 | -17.8 | -19.3 | ||
| Casper MSA2 Building Permits | 50 | 51 | 194 | -2.0 | -74.2 | ||
| Valuation | $7,375,000 | $7,348,000 | $17,292,000 | 0.4 | -57.4 | ||
| Cheyenne MSA Building Permits | 37 | 54 | 46 | -31.5 | -19.6 | ||
| Valuation | $6,031,000 | $7,942,000 | $7,529,000 | -24.1 | -19.9 | ||
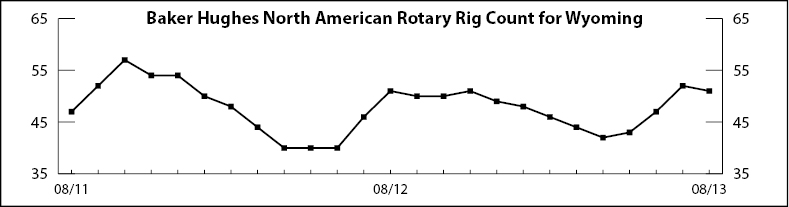
| Baker Hughes North American Rotary Rig Count for Wyoming | 51 | 52 | 51 | -1.9 | 0.0 | ||
|
|||||||
| (p) Preliminary. (r) Revised. (b) Benchmarked. | |||||||
| 1Local Area Unemployment Statistics Program estimates. | |||||||
| 2Metropolitan Statistical Area. | |||||||
| Note: Production worker hours and earnings data have been dropped from the Economic Indicators page because of problems with accuracy due to a small sample size and high item nonresponse. The Bureau of Labor Statistics will continue to publish these data online at http://www.bls.gov/eag/eag.wy.htm. | |||||||